Insulin is a life-saving medication for millions of Americans who live with diabetes. As the price of insulin has risen, people who depend on insulin have had to make difficult decisions about whether to pay for their medication or other necessities. Some have been forced to ration their supply, with devastating results. Recent legislation has limited insulin out-of-pocket costs at the state and federal level. For example, the Inflation Reduction Act, enacted in 2022, included a measure capping the out-of-pocket price for a 30-day supply of insulin at $35 for people enrolled in Medicare. Federal legislation to similarly reduce out-of-pocket prices for people enrolled in private insurance has been introduced but has not yet passed.
Eli Lilly, Novo Nordisk, and Sanofi, the three main drug manufacturers that supply insulin in the U.S., announced in March 2023 that they would cut U.S. prices and cap out-of-pocket costs of insulin products. Data on current and historical insulin prices is critical to understanding how these price changes and spending limits might affect people with diabetes, as well as their insurers and employers. Earlier HCCI work showed that, from 2012 to 2016, the point-of-sale price for insulin approximately doubled. In this brief, we update that analysis to understand how insulin prices have changed nationally over the past ten years using HCCI's commercial claims data from 2012 through 2021.
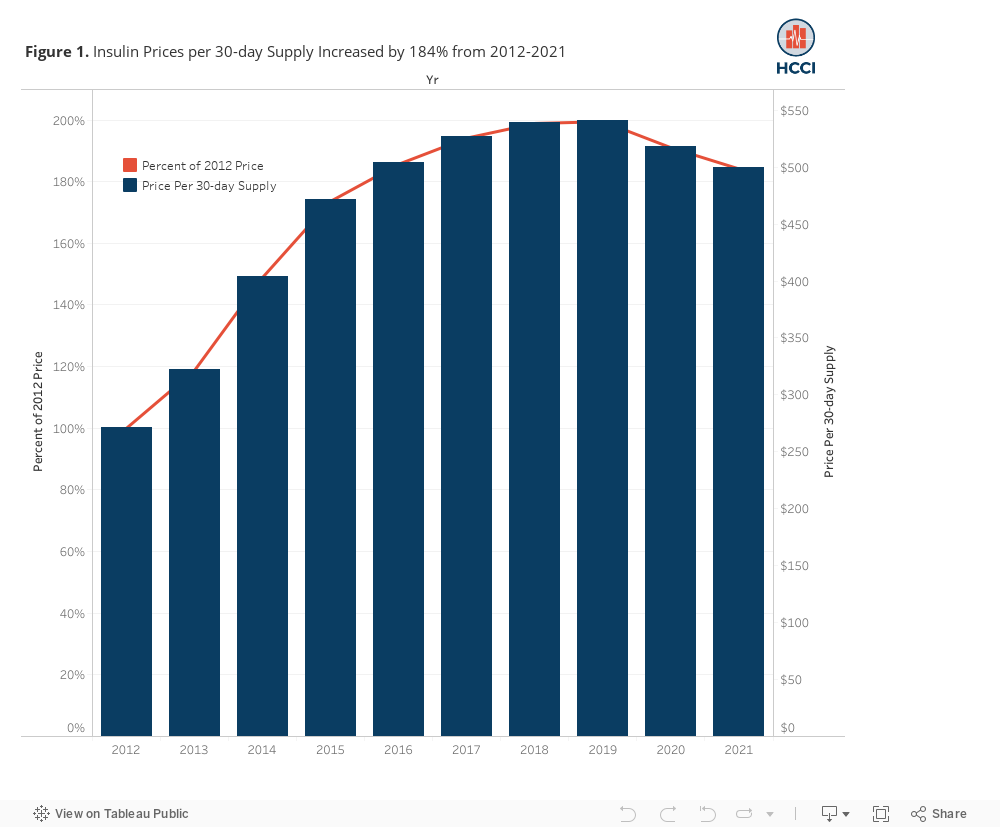
Insulin Prices Rose by 184% from 2012 to 2021
Across all insulin types, the price of a 30-day supply of insulin increased from $271 in 2012 to $499 in 2021, a 184% increase. As shown in Figure 1, from 2012 to 2016, insulin prices increased at the highest rate, nearly doubling, and reaching just over $500 for a 30-day supply in 2016. From 2017 to 2019, prices continued to increase, although at a slower rate. Following a peak in the average price ($541) in 2019, prices decreased by 8% between 2019 and 2021. As described below, this pattern was similar in both long acting and fast or intermediate acting types of insulin. Note that insulin prices reflect negotiated discounts from wholesale or list prices but do not account for manufacturer rebates, coupons or other discount programs provided through separate transactions.
Price Trends Varied for Fast and Intermediate-Acting Insulins Compared to Long-Acting Insulins
Types of insulin vary in terms of how quickly they start working to lower blood sugar as well as how long they last; some may be taken right before a meal, others provide a steady source of insulin over a full day or longer. Often, people with diabetes take more than one form of insulin.
For this analysis, we categorized insulin into:
- Long-acting. Covers insulin needs for a full day.
- Fast or Intermediate-acting. Lower blood sugar within minutes, sometimes up to an hour.
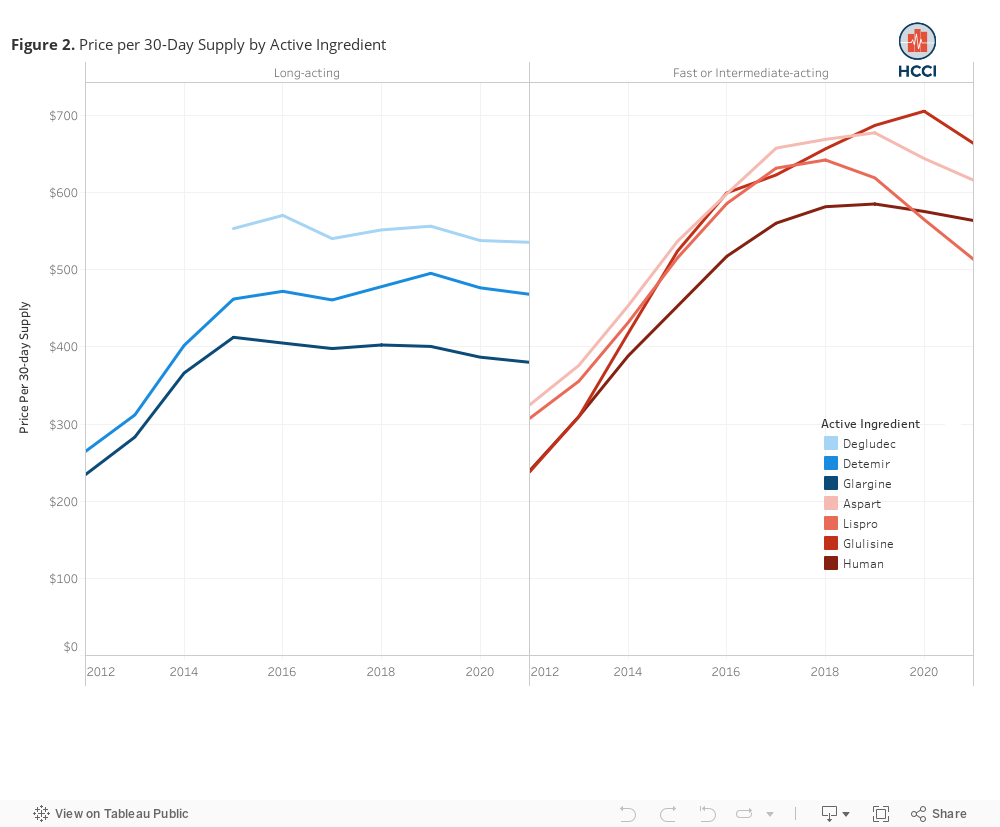
As shown in Figure 2, the price of all insulin types nearly doubled or more than doubled from 2012-2016.
Long-Acting Insulins. The price of long-acting insulins rose most dramatically from 2012-2015, by between 72-78%. In subsequent years, prices decreased modestly. Between 2016 and 2021, the price of all long-acting insulins decreased by between 0.8-6%. For example, the average price of a 30-day supply of glargine was $234 in 2012. It grew 176% between 2012 and 2015, reaching a peak average price of $412 in 2015. The price of glargine then declined slightly to $380 in 2021.
Fast or Intermediate-Acting Insulins. As with long-acting insulins, the average price of most fast or intermediate-acting insulins nearly doubled from 2012-2016. Price increases after 2016 moderated, but, unlike their long-acting counterparts, the average price of most fast or intermediate acting insulins continued to climb until between 2018 and 2020. In fact, the price of most fast or intermediate acting insulins increased by between 6-15% from 2016 to 2019 Prices for all fast and intermediate-acting insulins peaked between 2018 and 2020, and began to fall in subsequent years.
Biosimilar Insulin Options Likely Contributed to Recent Price Declines
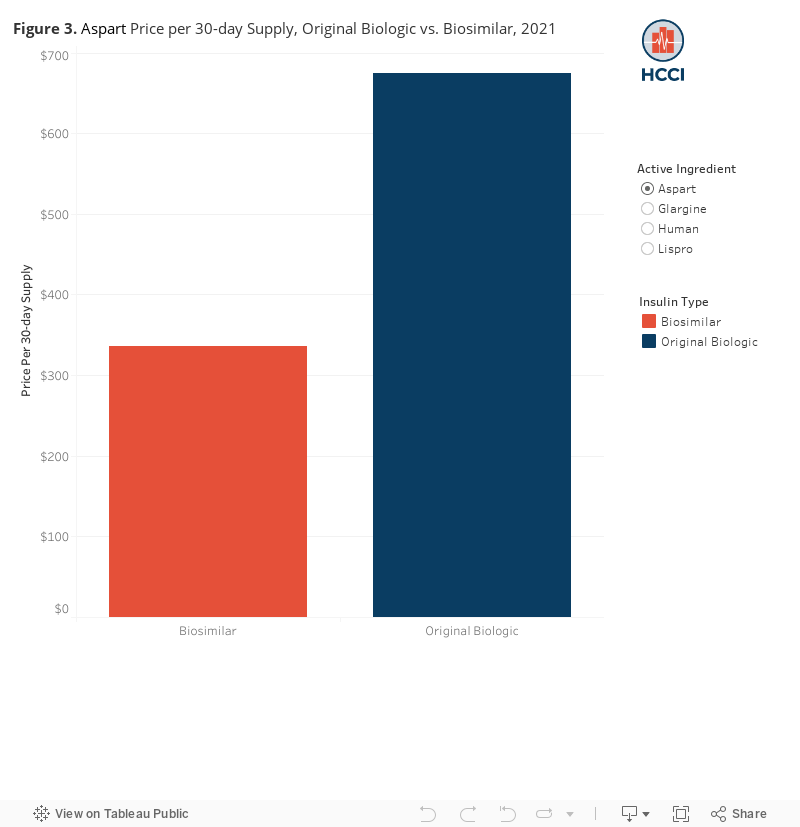
Some of the decrease in insulin prices from 2019-2020 was driven by the entry of several less costly, clinically similar versions of insulin, called biosimilars. In 2021, biosimilar insulin prices were between 21% and 67% lower than the price of the original biologic, as shown in Figure 3. For each original insulin biologic that has an associated biosimilar, there was a decline in prices starting the year the biosimilar became available or the year before.
For example, the price of lispro started to decline in 2019. Follow-on biologics and biosimilars became available for lispro in 2019. We observe similar trends for aspart, human and glargine insulins in 2020, all of which became available between 2019 and 2021.
The impact of biosimilar introduction on the overall price of the drug class was dependent on use of those products compared to the original biologic as well as the price difference.
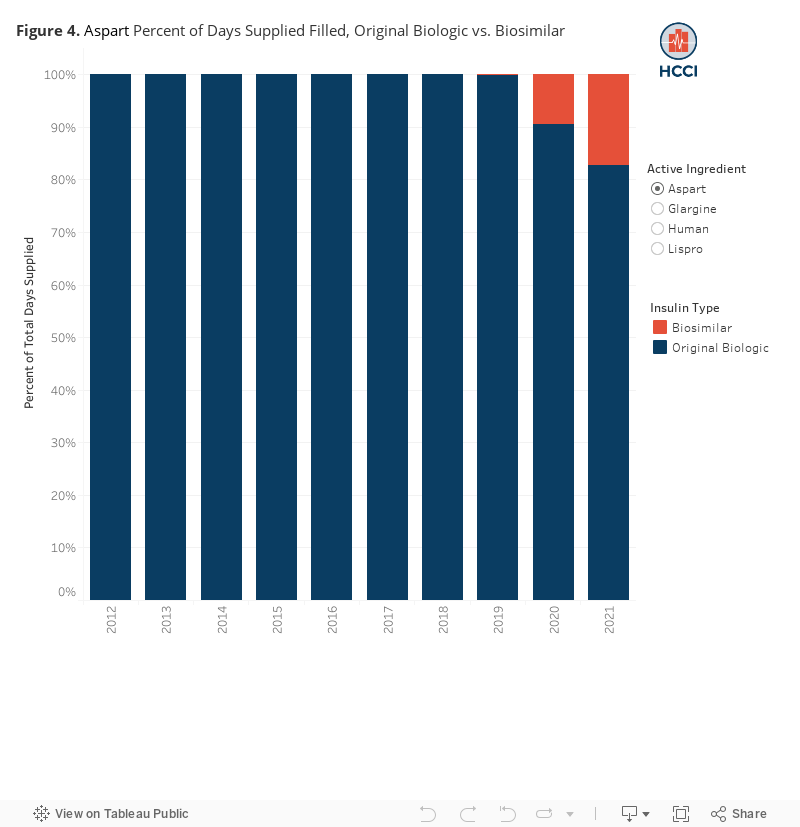
Despite relatively low use of insulin biosimilars, their uptake varied by insulin active ingredient. In 2021, only about 8% of total insulin days supplied were for biosimilars, but 23% of lispro days supplied were for lispro biosimilars. In contrast, only 0.01% of glargine days supplied were for glargine biosimilars (Figure 4).
Discussion
Overall, insulin prices in 2021 were 184% higher than they were in 2012. Following dramatic increases 2012-2016, price growth leveled off and even started to decline in recent years. We see these trends across insulin types, which likely reflects the impact of biosimilars entering the market.
Our data show the potential of biosimilars to lower costs. In the first three years that insulin biosimilars were available, we see that average prices began to decrease, despite the fact that only 8% of total days supplied were for biosimilars. Longer term effects on average prices will be dependent on the uptake of biosimilars and relative prices over time. There are many factors that may lead to variation in biosimilar uptake, including payer coverage, operational considerations (e.g., feasibility of stocking multiple versions of a product), prescriber preferences, and patient perceptions of biosimilar efficacy.
Insulin prices have very real impacts on people with diabetes. High prices can translate to difficult choices between paying for insulin and other necessities like food and housing. While this study examined prices that people with insurance through their employers pay for insulin, prices are an even higher barrier to use among those with no insurance coverage. Forthcoming insulin price cuts will likely have the biggest financial impact on individuals without insurance as well as those in high deductible and high cost-sharing plans. These price cuts, along with spending caps, have the potential to make insulin more accessible to people who need it and reduce the cost burden on this population and their insurers, allowing resources to be reallocated toward other necessities and investments in health.
Methods Note
We calculated average prices of 30-day supply fills for prescriptions of all types of insulin products listed in the 2021 RxNorm file, using claims data from the Health Care Cost Institute.
The average price calculation was derived by summing the total allowed amounts on all insulin claims, then dividing the sum of total allowed amounts by the sum of total days supplied. This gave us a unit price per 1 day supply, which we multiplied by 30 to get the price per 30-day supply. Note that allowed amounts for prescription drugs reflect negotiated discounts from wholesale or list prices but do not account for manufacturer rebates, coupons or other discount programs provided through separate transactions.