The 2018 Health Care Cost and Utilization Report presents data on health care spending, utilization, and average prices from 2014 through 2018 for individuals under the age of 65 who receive health insurance coverage through an employer.
The report draws on data from more than 2.5 billion medical and prescription drug claims for approximately 40 million individuals enrolled in employer-sponsored health insurance annually between 2014 and 2018 based on de-identified commercial health insurance claims contributed by Aetna, Humana, Kaiser Permanente, and UnitedHealthcare.
The key findings are:
- In 2018, per-person spending increased to $5,892. This total includes amounts paid for medical and pharmacy claims but does not subtract manufacturer rebates for prescription drugs. The average out-of-pocket spending increased to $907 per person.
- Health care spending grew 4.4% in 2018, slightly above growth in 2017 of 4.2%, and the third consecutive year of growth above 4.0%.
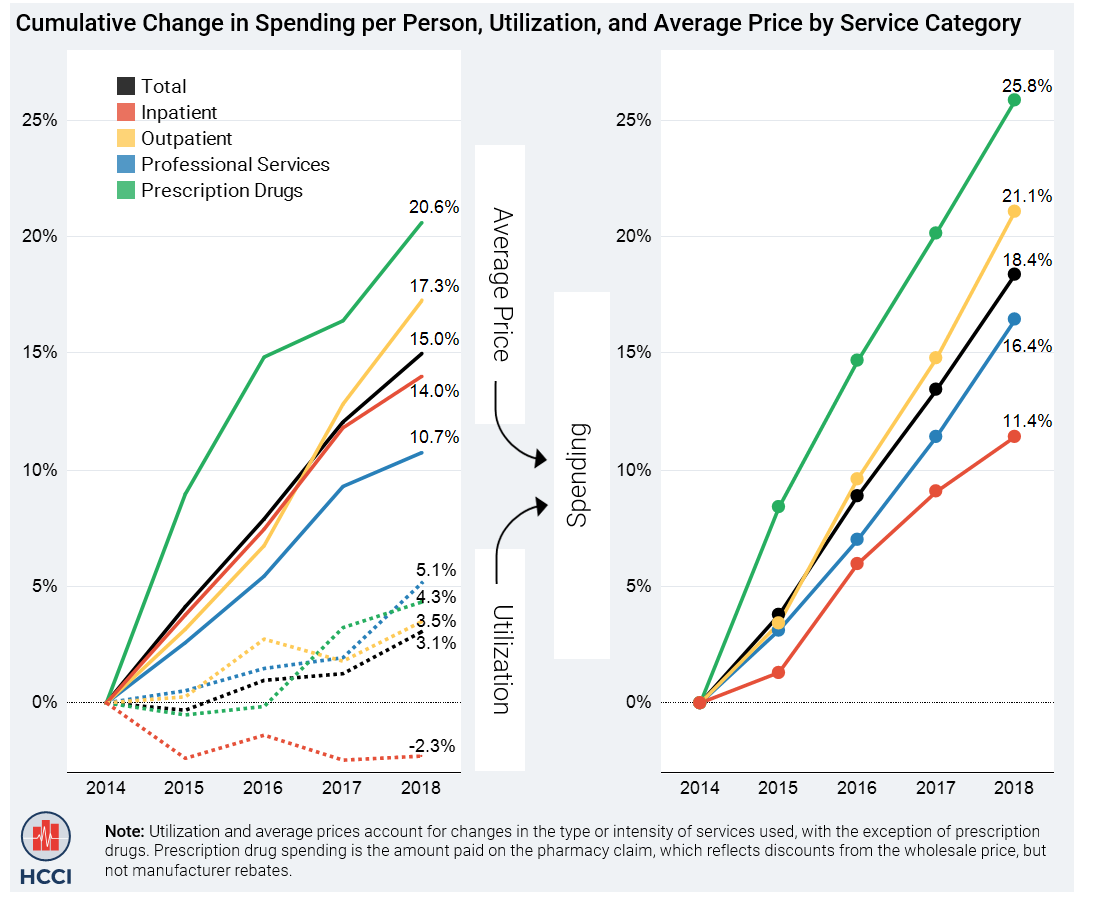
- After adjusting for inflation, prices accounted for three-quarters of spending growth between 2014 and 2018, contributing $453 to spending per person over the five-year period.
- Average prices grew 2.6% in 2018. While that is the lowest rate of growth over the period, consistent year-over-year increases mean that prices were 15.0% higher in 2018 than 2014.
- Utilization grew 1.8% from 2017 to 2018, the fastest pace observed during the five-year period. And because of the higher price levels, the effect of the increase in utilization in 2018 on total spending was higher than it would have been in 2014.
This report examines trends within four categories of service: inpatient admissions; outpatient visits and procedures; professional services; and prescription drugs. All data were weighted to reflect the age, gender, and geographic mix of the employer-sponsored insurance (ESI) population.