Introduction
Excessive emergency room (ER) spending and utilization have long been major areas of focus for health care stakeholders. The ER is an important source of health care for many individuals, especially those who lack a usual source of care, or those with work schedules that limit the ability to access care during "normal business hours." But an ER visit can be extremely expensive, and patients may face high out-of-pocket costs due to cost sharing or a lack of insurance. Further, a series of news articles and studies have highlighted that many insured patients face hefty "surprise" bills from ER visits when they go to a hospital that is in their insurer's network but unknowingly receive services from a physician who is outside their network. Recent legislation, the "No Surprises Act," aims to protect patients from these ER bills.
The Agency for Healthcare Research and Quality estimates that American emergency room visits cost $76.3 billion in 2017. These costs are not borne equally, with Black Americans more likely than white Americans to receive medical care in emergency departments as opposed to primary care settings. Given these large and inequitable costs, as well as policy-relevant issues such as surprise bills, entry of freestanding ERs, and acquisition of ER physicians by private equity firms, researchers and policymakers have sought a better understanding of ER visits, including the prevalence of unnecessary care and rising costs.
In this brief, we use Health Care Cost Institute's (HCCI) unique commercial claims dataset, containing claims for 55 million Americans annually, to examine how spending, utilization, and prices for ER services have changed over time. Additionally, we examine patient out-of-pocket costs and the role of out-of-network services which have the potential to lead to surprise bills. ER patients may receive a variety of bills including bills from surgeries, radiological procedures, and laboratory testing. For this analysis, we focus on over 46 million ER services that are billed as a facility-based charge for evaluation and management (E&M) by a physician. A common type of ER bill, these E&M services can be interpreted as the price of entering an ER.
Key Findings
- Every year, 1 in 9 people with employer-sponsored health insurance has an ER visit.
- Spending per person on ER visits increased 51% from 2012 to 2019.
- The average price of an ER evaluation and management visit was $1,055 in 2019, increasing 57% from 2012 to 2019.
- Overall utilization of ER declined slightly (-4%) from 2012 to 2019.
- Coding of ER visits has shifted towards more severe, higher priced codes.
National Trends in Spending, Use, and Price of ER Evaluation and Management Codes
We examined spending on ER E&M services from 2012 to 2019 among nearly 55 million individuals annually under the age of 65 with employer-sponsored health insurance (ESI). We defined a visit as a patient and date combination in which at least one of the five ER E&M CPT codes (99281 – 99285) were billed (65.6 million visits). Spending in our study was limited to dollars spent on these five ER E&M codes.
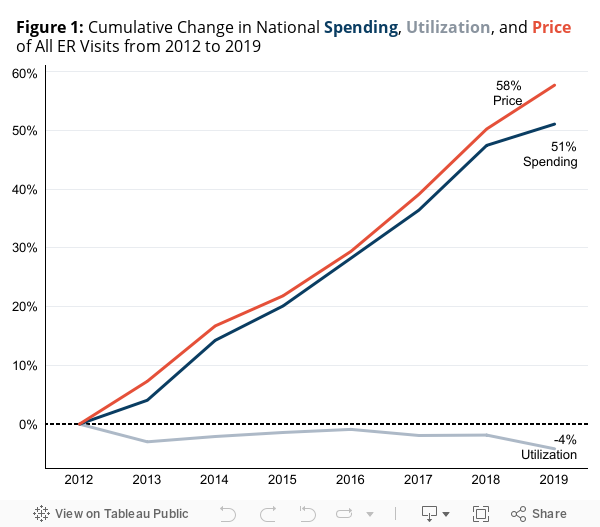
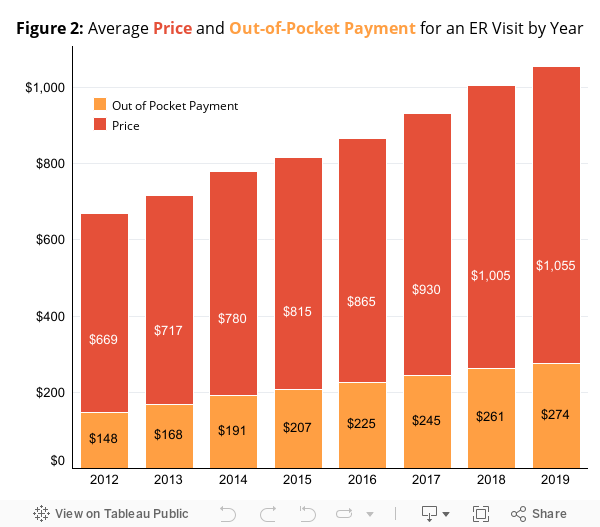
Between 2012 and 2019, spending on ER E&M visits increased 51% per capita (Figure 1). This spending increase was entirely due to a 58% increase in the price of visits. Utilization, measured as visits per capita, decreased 4% over the study period. Rising prices also impacted the amount that patients paid out-of-pocket for ER E&M services (Figure 2). While a patient in 2012 paid an average of $148 out-of-pocket for an ER E&M visit, a patient in 2019 paid an average of $274 out-of-pocket for the same service – an increase of 85%.
Why has the price of an ER visit risen?
There are two main factors that could cause increasing ER visit prices: first, a shift towards higher severity ER codes being billed, given these more severe codes have higher costs than less severe codes; and second, relatively larger price increases for visits with high severity ER codes.
To examine these factors, we categorized ER visits into one of six categories of visit severity, depending on the ER E&M codes billed as part of the visit. ER E&M fees can be billed to the patient either from the ER facility itself, directly from the rendering physician, or, most commonly, by both the ER and the physician. In 2019, 71% of ER visits resulted in bills from both entities, representing 84% of spending on ER E&M fees. Due to their pervasiveness and high share of ER spending, we limited subsequent analyses to ER visits billed by both physicians and facilities.
We categorized the 46.7 million ER visits in our final analytic sample into one of six categories of severity. In cases where the bill included only one E&M code (65%), visits with codes 99281 or 99282 were designated "low severity," visits with code 99283 billed were designated "medium severity," and visits with codes 99284 or 99285 billed were designated "high severity." In cases where multiple E&M codes were billed to the same patient on the same dates and those codes spanned more than one category, a combined label was created (35%). For example, in cases where patients were billed at both 99283 and 99285, the visit was designated as High-Medium. Instances in which CPT codes from all 3 levels (low, medium, and high) occurred during the same visit were dropped from the analysis (less than 0.5% of visits).
A Shift Toward Higher Severity Services Led to an Increase in ER Prices
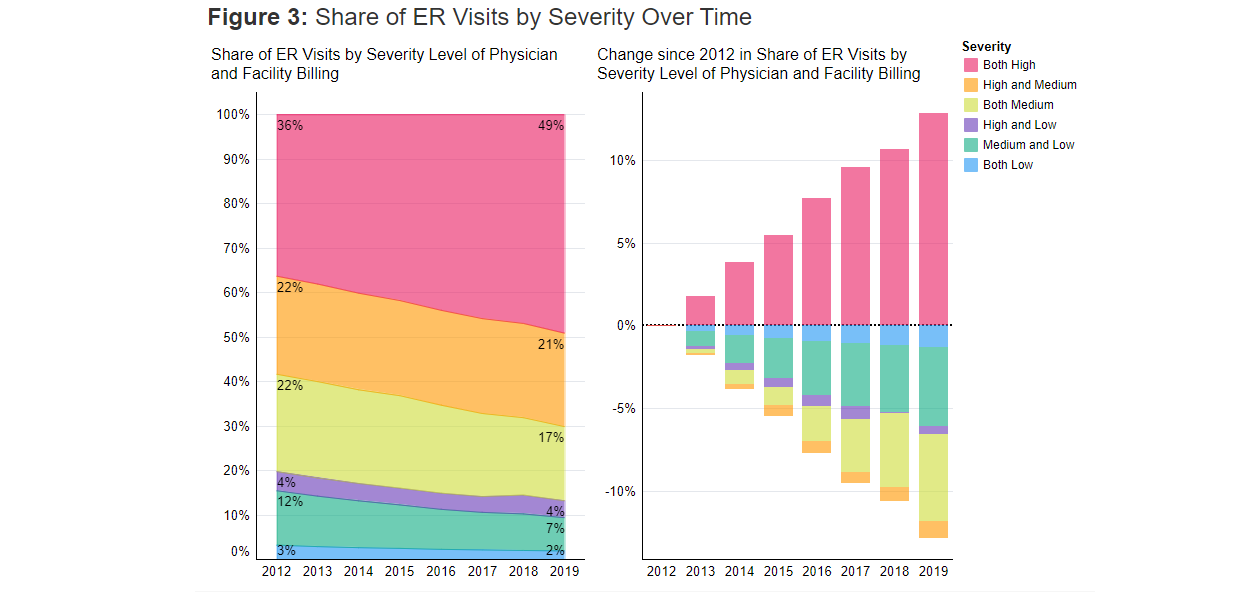
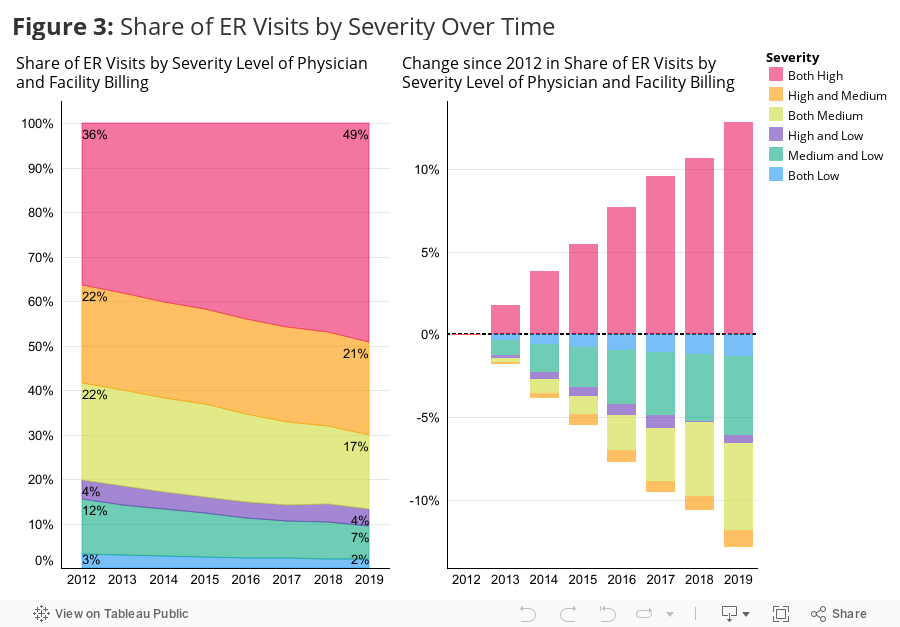
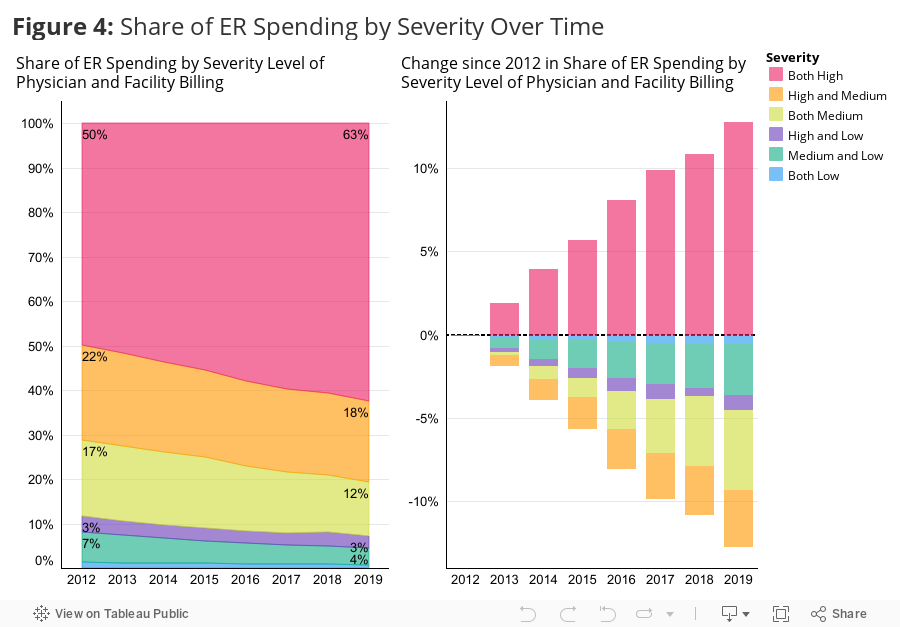
Among the six categories, high severity visits made up the largest share of visits and spending by far. In 2012, more than one-third of visits (36%) (Figure 3) and half (50%) of spending (Figure 4) were categorized as high severity. High-medium severity visits had the second largest share of visits and spending in 2012, with 22% and 21% of visits and spending, respectively.
The category of high severity visits was also the only category with an increase in utilization and spending between 2012 and 2019. All other categories of severity experienced a decrease in both measures. As shown in Figure 3, high severity visits grew from 36% of visits in 2012 to 49% of visits in 2019 (a 13 percentage point increase). In contrast, over this period, high-medium visits declined from 22% to 21% of visits, and medium visits declined from 22% to 17%. The remaining categories – high-low, medium-low, and both low – accounted for 19% of visits in 2012 and 13% in 2019.
In terms of spending (Figure 4), high severity visits made up 63% of spending in 2019, up from 50% in 2012. High-medium visits declined from 21% to 18% of spending, medium visits declined from 17% to 12% of spending, and medium-low visits declined from 7% to 4% of spending. The remaining categories accounted for less spending and remained relatively flat over time.
There are two likely drivers of these shifts in billing severity. First, patients receiving ER services may have more complex needs over time (e.g., they are more likely to wait to go to the ER until they are quite sick, resulting in higher severity visits). Second, these trends may be the result of changes in practice and billing patterns, as there are financial incentives for coding higher severity visits. Unfortunately, we cannot easily disentangle these mechanisms in our data.
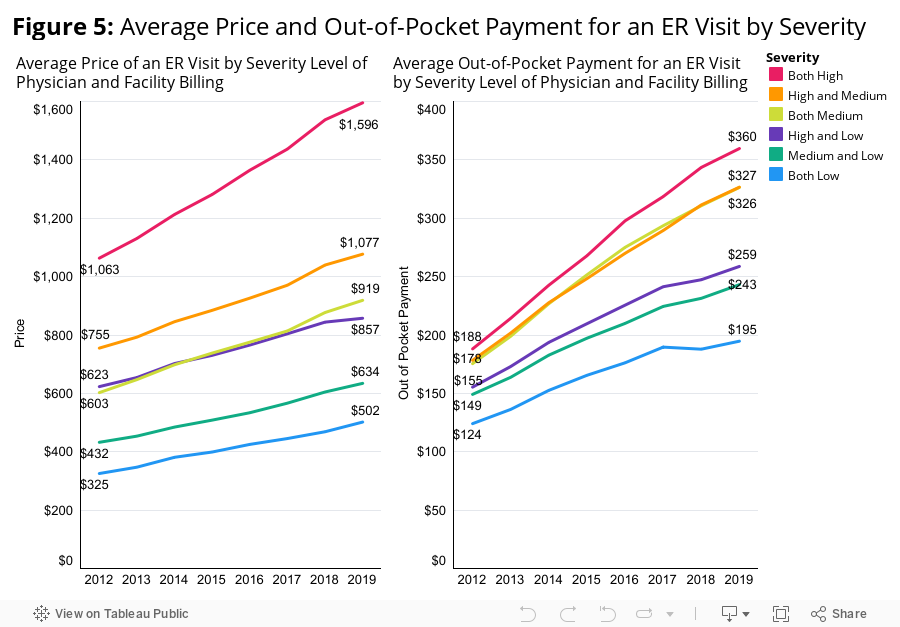
High Severity Visits Experienced the Largest Nominal Growth in Prices among the Severity Categories
Figure 5 shows that high severity visits had the largest nominal increase in price per visit (+$533, increase of 50%). High severity visits were already the most expensive of the categories in 2012, with an average price of $1,063, and became even more expensive by 2019 ($1,596). High-medium and medium severity visits had the next largest increases in price, rising $322 and $316 per visit over the study period, respectively. While prices for the lower severity visits did not increase by as much as their higher severity counterparts, prices for all six categories increased over time.
The Role of Out-of-Network Services and Prices
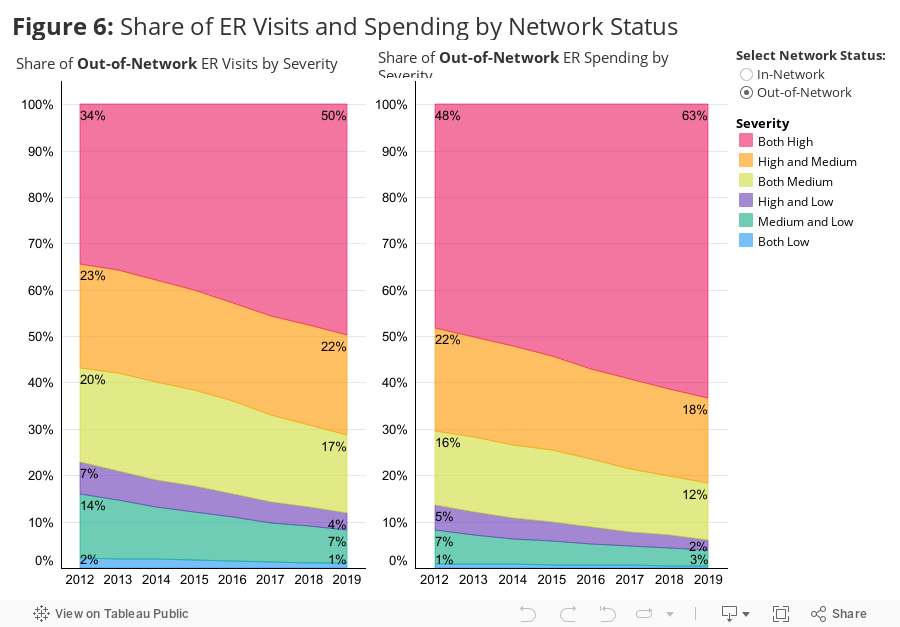
Given the policy focus on "surprise" ER bills, we examined the frequency and spending associated with out-of-network ER services. Specifically, we identified services where the facility was in-network but the patient received a service from an out-of-network provider since these instances are most likely to prompt a "surprise" out-of-network bill. We examined the share of ER services and spending that were out-of-network (i.e., in-network facility and out-of-network physician) and the total and out-of-pocket prices for these services. Overall, the share of ER visits that were out-of-network stayed consistent between 2012 (12%) and 2019 (11%) and the distribution of these visits and spending across severity levels is consistent with the distribution of visits and spending among all visits (Figure 6).
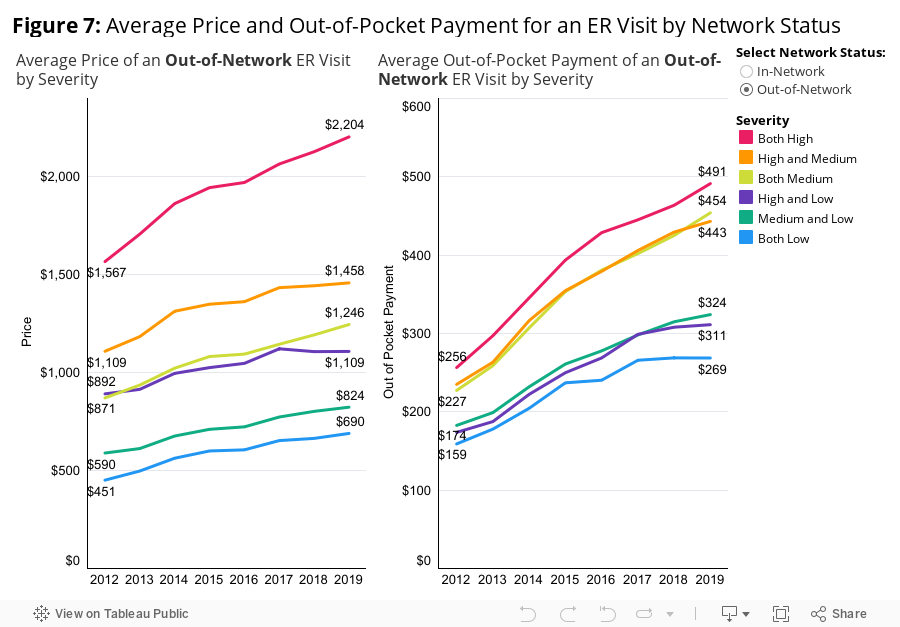
Across severity levels, the average total price for an out-of-network ER visit was higher than the in-network price for a visit of the same severity. However, in-network prices rose faster over time. For example, the price of a high-severity visit in 2012 was $1,567 out-of-network compared to $999 in-network. The average in-network price of a high-severity visit rose from $999 to $1,523 over the 2012-2019 period (52%) compared to a rise in the average out-of-network price from $1,567 to $2,204 (41%). Across all severity categories, in-network total prices rose faster than out-of-network total prices over this period.
Out-of-pocket payments were higher for out-of-network visits at all severity levels. Importantly, these out-of-pocket payments do not capture any bills a patient may receive directly from the provider of the out-of-network service and therefore likely underestimate the full cost to the patient of these visits. As observed in the claims data, the average out-of-pocket payment in 2019 for a high severity ER visit was $491 if the visit was out-of-network compared to $344 in-network. The out-of-pocket payment associated with a high severity visit grew 92% over this period among both in- and out-of-network visits.
Policymaker Actions to Lower Out-of-Pocket Costs for ER Services
Spending on emergency room evaluation and management codes (ER E&M) increased significantly over the 2012-2019 period. This increase was almost entirely due to price increases, as overall ER use decreased slightly over time. The average total price for an ER E&M visit rose 58% over this period, while the average out-of-pocket payment increased 85%.
High severity visits have consistently been the most expensive and most frequently billed ER E&M services. Across the study period, these services experienced the largest nominal increase in price. Further, they were the only category of service to see its utilization rate increase over time, while there were declines in all other severity-based categories of visits.
Out-of-network visits were more costly overall and to patients in terms of out-of-pocket costs than in-network visits at all categories of visit severity, however total in-network prices rose faster than out-of-network prices from 2012-2019. This trend suggests that protections from out-of-network bills (e.g., The No Surprises Act) are a good start but are unlikely to be sufficient in efforts to lower the financial burden of ER care on patients.
While this analysis does not capture all emergency room spending by patients (such as spending on labs, imaging, etc.), nearly every patient entering the ER receives an E&M bill during their stay. Therefore, analyzing E&M services provides a standard window into one of the most common costs that patients face when seeking care in an ER. The combination of rising prices overall and trends in high-severity coding prompt a need for further policy action to mitigate the adverse health and financial outcomes of high ER costs for patients.
Methods Note
Costs patients incurred for other ER services, including labs, radiology, and surgical procedures, among others, were not included in this analysis. We did not include any ER claims in our analysis for patients who were admitted for an inpatient stay after an ER visit.
Cases where multiple ER E&M codes were billed to the same patient on the same day counted as one visit with all dollars spent on those codes counting toward total spending. Cases where multiple E&M codes were billed to the same patient on the same dates and those codes spanned more than one category, a combined label was created.
CPT Codes Billed by Physician and Facility: Severity Designation- 99284, 99285: Both High
- 99283 and (99284, 99285): High - Medium
- 99283: Both Medium
- (99281, 99282) and (99284, 99285): High - Low
- (99281, 99282) and 99283: Medium - Low
- 99281, 99282: Both Low