
As the production and distribution of SARS-CoV-2 vaccines ramps up in the United States, there is a need to ensure that communities at highest risk for severe COVID-19 morbidity and mortality are targeted.
As of February 2021, the Pfizer/BioNTech and Moderna mRNA vaccines, which were approved by the U.S. Food and Drug Administration (FDA) under Emergency Use Authorization (EUA) in late 2020, remain the only SARS-CoV-2 vaccines on the market. Given that mRNA, a key component of the vaccines, can easily degrade, initial guidance was that the vaccines need to be stored at between -80oC and -60oC (-112oF and -76oF), which limits the distribution of vaccine to providers with access to working ultra-cold freezers, although Pfizer has recently submitted an application to the FDA suggesting that their vaccine can be stored in conventional freezers. These storage requirements have resulted in the majority of vaccines being administered at specialized locations or hospitals, as opposed to physician offices or pharmacies where the vast majority of flu and other vaccines are traditionally administered. Additionally, both the Pfizer/BioNTech and Moderna require a two-dose administration, spaced 21 days and 28 days, respectively. Both the storage and administration requirements present a bottleneck to quick, wide-spread distribution. Johnson & Johnson has also developed SARS-CoV-2 vaccine, but rather than using mRNA, the Johnson & Johnson vaccine uses more stable DNA to encode the spike protein instructions that induce an immune response; the use of more stable DNA allows the vaccine to be stored at 2 to 8oC (36 to 46oF). Additionally, the Johnson & Johnson vaccine only requires a single dose. With the expectation that the Johnson & Johnson vaccine will be approved by the FDA under EUA in the coming days (EUA committee will meet Friday, February 26th). With the lower hurdles for administration of the vaccine, there is an expectation that more providers will be able to deliver the vaccine in more diverse settings, specifically doctor’s offices and community pharmacies.
The distribution of vaccines to a wider group of providers will help better engage communities in the vaccination process. Of especially important note is the disproportionate and devastating impact of COVID-19 on certain communities. Over the last year, studies have shown that older people, people with co-morbid conditions including cancer, obesity, diabetes, and chronic kidney disease, and Black, Hispanic, American Indian and Alaskan Natives are at higher risk of severe COVID and death. Initial reporting has also shown that Black and Hispanic populations in particular, have not been vaccinated at rates on par with the general population. Reporting suggests this this is both a health access and equity issue, as well as an issue of community suspicion in the safety and efficacy of the vaccine. In an effort to help highlight which providers serve the highest risk populations and allow policymakers and local health departments to target outreach, distribution, and intervention, we have created an interactive map that identifies providers who serve the most vulnerable populations.
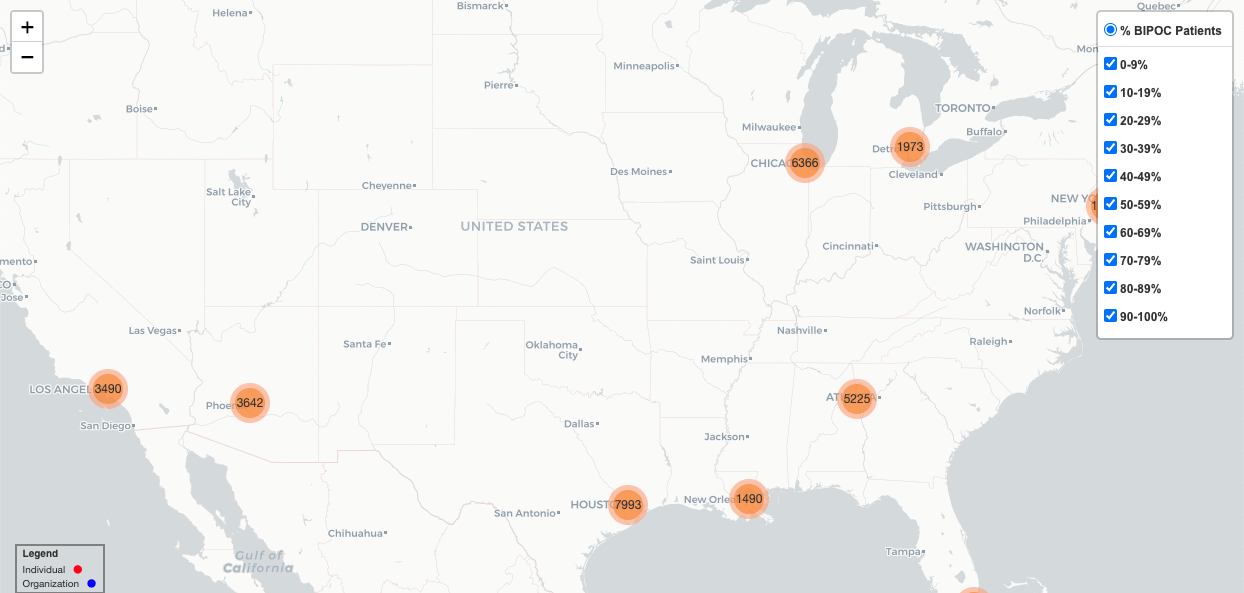
Utilizing information from the Centers for Medicare and Medicaid Services (CMS), we mapped data from over 1.5 million providers and suppliers. We geocoded provider addresses beginning with eleven target cities that scored high on the Community Vulnerability Index: New Orleans (LA), Atlanta (GA), Los Angeles (CA), Miami (FL), Houston (TX), Birmingham (AL), Phoenix (AZ), Chicago (IL), Detroit (MI), New York, (NY,) and Philadelphia (PA). The interactive map below allows users to select providers that serve beneficiaries with demographic and clinical characteristics that put them at risk for severe morbidity and mortality, including beneficiaries with diabetes, beneficiaries with hypertension, and Black, Indigenous, and other people of color (BIPOC), which include beneficiaries who are either Black, Hispanic, Asian, or American Indian or Alaskan Natives. This effort represents an important data-driven tool to help policymakers and providers engage with the communities they serve and encourage a more equitable distribution of COVID-related health resources, including vaccines than we have seen to date.
Note that not every provider is included in the map; we include only those providers who have submitted claims for a threshold number of Medicare Fee-for-Service (FFS) beneficiaries. The data is available for download below and more information about the data sources and models, as well as the limitations of the analysis can be found in the methods section. We excluded providers with incomplete or missing columns on beneficiaries’ race.
Click on the map below. Please be patient- it is a beta test and will take 10-15 seconds to load.
Methods
Data on the names, credentials and addresses of the providers in the map are derived from the National Plan & Provider Enumeration System (NPPES). CMS developed the NPPES to assign unique identifiers, known as National Provider Identifiers (NPIs), to health care providers. The health care provider’s address information is collected at the time of enrollment and updated periodically. Note that physician addresses are not continuously updated, nor or they current (i.e., they reflect data as of 2018).
Physicians’ addresses were cleaned and standardized prior to geocoding (mapped to longitude and latitude) using Google Maps Geocoding Application Programming Interface (API) and US Census Bureau API. Data cleaning and geocoding was processed using R version 4.0.2 and associated packages (www.r-project.org). The interactive physician map was created using Python version 3.7 and associated packages.
Data used to create the map come from the 2018 Physician and Other Supplier PUF, which is generated from CMS administrative claims data for Medicare beneficiaries enrolled in the fee-for-service (FFS) program. Weighted mortality risk scores were generated using 100% of Medicare enrollment and fee-for-service claims data summarized from the Master Beneficiary Summary File (MBSF) and Part B non-institutional claims (NCH Claim Type Codes ’71’ and ’72’).
Model coefficients of the hazard ratio for COVID-19 death were derived from a validated COVID-19 mortality risk calculator (Jin, J., Agarwala, N., Kundu, P. et al., 2020). Coefficients from the model found in Supplementary Table 1 were applied to calculate risk for mortality for beneficiaries 65 and older. Note, we did not make any adjustments for geography. We excluded beneficiaries younger than 65 since eligibility for Medicare under 65 represents a unique cohort with a more complex profile than the under-65 population represented in the general model. The model developed by Jin, J., Agarwala, N., Kundu, P. et al. used information on the prevalence and co-occurrence of risk factors from various national databases to make population-level projections of risk associated with predisposing factors for the adult population across 477 US cities and for the 65-years-and-older population enrolled in Medicare across 3,113 US counties. Not all factors from the risk model were scored using the Medicare data given the unavailability of certain metrics in claims data. Factors included in our risk calculations and their respective coefficients are included in Supplemental Figure 1. Supplemental Figure 2 shows the distribution of the risk ratio’s for beneficiaries scored and is consistent with the distribution of scores in the original model.
Supplemental Figure 1. Model coefficient for each category of various risk factors.
| Variable Type | Variable | Log-Hazard Ratio |
| Age | 65 to 74 | 0.775 |
| 75 to 84 | 1.647 | |
| 85+ | 2.744 | |
| Sex | Female | 0.000 |
| Male | 0.432 | |
| Race/Ethnicity | White | 0.000 |
| Black | 0.968 | |
| Asian | 0.302 | |
| Hispanic | 0.854 | |
| American Indian, Alaska Native | 0.539 | |
| Other/Unknown | 0.000 | |
| Chronic/Comorbid Conditions1 | Hypertension | -0.094 |
| Respiratory disease2 | 0.501 | |
| Asthma | -0.047 | |
| Chronic heart disease (CHF) | 0.148 | |
| Diabetes, controlled3 | 0.247 | |
| Diabetes, uncontrolled3 | 0.621 | |
| Hematological cancer, <1yr4 | 0.845 | |
| Non-hematological cancer, <1yr4 | 0.513 | |
| Stroke or dementia | 0.770 | |
| Chronic kidney disease | 0.362 | |
| Rheumatoid arthritis | 0.140 | |
| Other Factors | Obesity4 (Class II) | 0.344 |
| Smoking | Not Scored | |
| Indices of Multiple Deprivation | Not Scored | |
| Geography | Not Scored |
- Chronic and acute conditions were calculated using ICD-10 diagnoses from 2018 Part B non-institutional claims and categorized using Chronic Conditions Warehouse definitions unless otherwise specified.
- Respiratory disease used all ICD-10 “J” codes, with the exception of asthma.
- Uncontrolled diabetes was differentiated from controlled diabetes if the beneficiary had a claim for a hospitalization with a diabetes DRG.
- Cancers within the previous year were flagged where there was a claim for a hospitalization with a cancer DRG (e.g., treatment); a diagnosis of cancer was not used to score the model; treatment or history of cancer >1 year was not scored.
- BMI is unavailable in claims data; a proxy for obesity was used if CPT codes 99401 or 99402 were submitted in a claim and scored as Class II Obesity
Supplemental Figure 2. Distribution of COVID-19 Risk Scores for Medicare Beneficiaries Age 65+

Supplemental Figure 3 shows the proportion of the aged population in each of the risk categories for the research undertaken by Jin, J., Agarwala, N., Kundu, P. et al., derived from the Centers for Disease Control and Prevention (CDC) National Health Interview Survey (NHIS), and of that derived from the Medicare FFS provider data represented in the map.
Supplemental Figure3. COVID-19 Risk Categories for People Age 65+
| Risk Category | NHIS Population 65+ | Medicare Beneficiaries 65+ |
| Very High | 7.7% | 5.4% |
| High | 12.3% | 19.8% |
| Substantially Elevated | 28.4% | 38.9% |
| Moderately Elevated | 22.7% | 16.8% |
| Lower Risk | 28.9% | 19.2% |
Limitations
While the Physician and Other Supplier PUF has a wealth of information on payment and utilization for Medicare Part B services, the dataset has a number of limitations. Of particular importance is the fact that the data may not be representative of a physician’s entire practice as it only includes information on Medicare FFS beneficiaries. Additionally, CMS suppression policy dictates that no data be reported for a cell size of fewer than 11 beneficiaries. The result of data suppression impacts providers who see a fewer number of Medicare FFS beneficiaries and may disproportionately affect rural and/or providers with smaller practices. Second, risk score metrics are only calculated for the population of Medicare FFS beneficiaries who are 65+, thus limiting the sample of scored beneficiaries; as a result, not all mapped providers may have an average COVID-19 risk score.
Resources
Jin, J., Agarwala, N., Kundu, P. et al. Individual and community-level risk for COVID-19 mortality in the United States. Nat Med (2020). https://doi.org/10.1038/s41591-020-01191-8
See: https://www.nature.com/articles/s41591-020-01191-8#Sec2
See: https://covid19risktools.com:8443/
Medicare Provider Utilization and Payment Data: Physician and Other Supplier Public Use Files
See: https://www.cms.gov/Research-Statistics-Data-and-Systems/Statistics-Trends-and-Reports/Medicare-Provider-Charge-Data/Physician-and-Other-Supplier
Building Confidence in COVID-19 Vaccines Among Your Patients Tips for the Healthcare Team
See: https://www.cdc.gov/vaccines/covid-19/downloads/VaccinateWConfidence-TipsForHCTeams_508.pdf
Google Maps APIs. See: https://developers.google.com/maps/documentation/geocoding/start
US Census Bureau APIs. See: https://geocoding.geo.census.gov/