Prenatal care leads to healthier pregnancy, healthier pregnant people, and healthier babies. In fact, birthing parents who receive prenatal care are three times less likely to deliver low birthweight babies, and the baby is five times more likely to survive delivery.
To explore the kind of prenatal care pregnant people receive, we looked at utilization of two prototypical prenatal services – laboratory testing and ultrasounds. Using HCCI’s unique dataset, a window into utilization of prenatal services among pregnant people who get insurance through an employer, we identify how many of those services are used, examine variation in use of those services, and assess how use of those services differed based on certain characteristics of the pregnant person.
Looking at 25.8 million claims from 2009 through 2015, we find that pregnant people who had at least one visit averaged 8.5 laboratory test visits in the 10 months before delivery.Over the same period, they had an average of 6.7 ultrasound visits. Overall, pregnant people in this sample received a wide range of laboratory and ultrasound visits – from zero to more than 20.
Utilization by Age
To understand better what is behind the different utilization of these prenatal services, we look at two categories of patient characteristics. First, we assess use of laboratory visits and ultrasound visits by age. Pregnant people age 35 and over are considered to be at “advanced maternal age,” and their pregnancies tend to be monitored more closely. As such, we would expect to see higher utilization of prenatal services among this population.
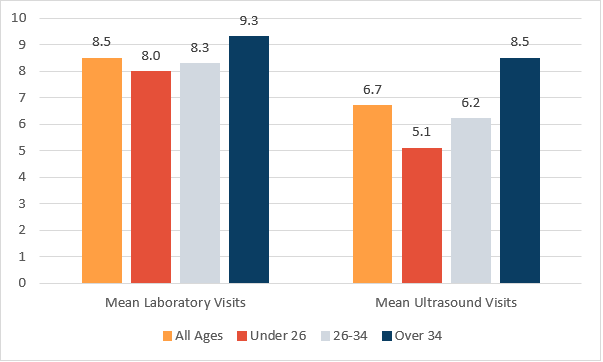
As shown in Figure 1, we observe some differences in the average number of visits by age.For example, pregnant people under age 26 had 8.0 laboratory visits on average (0.5 less than the overall average) while people over age 34 averaged 9.3 laboratory visits (0.8 more than the overall overage). People under age 26 averaged about 5 ultrasound visits (1.6 fewer than the overall average); people over 34 averaged 8.5 visits (1.8 more than the overall average).
Figure 1: Lab and Ultrasound Mean Visits by Age
Utilization by People at Greater Risk for Complications
We then look for differences in utilization patterns among pregnant people with a subset of diagnoses that suggest they may be at higher risk for complications during pregnancy or during delivery and, therefore, warrant additional monitoring in the prenatal period. We group claims with a diagnosis code for diabetes mellitus, hypertension, multiple gestation, obesity, and previous c-section as higher risk, expecting to see different utilization among pregnant people with these diagnosis codes than those without them.
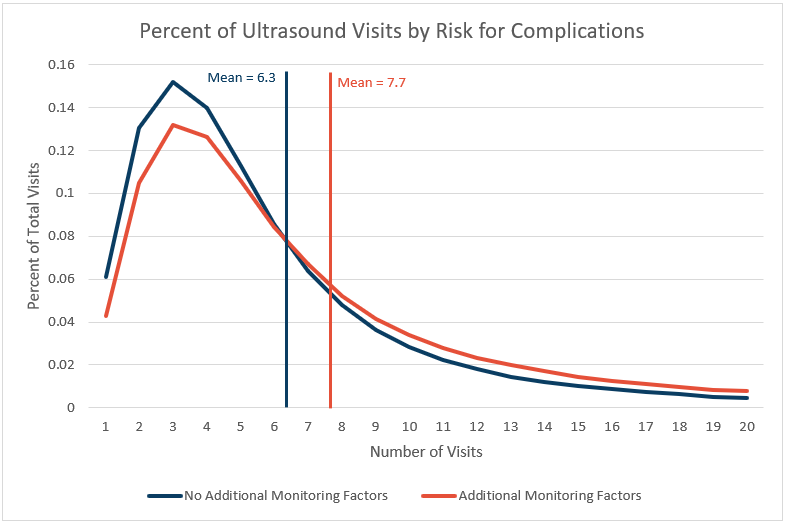
Across all age groups, people with a diagnosis suggesting additional monitoring may be necessary averaged 9.3 laboratory visits (0.8 more than the overall average, and 1.0 more than those without such factors). Similarly, people at higher risk for complications had 7.7 ultrasound visits (1.0 more than the overall average, and 1.4 more than those without such factors). Figure 2 shows how utilization varied by presence of characteristics that suggest additional prenatal monitoring.
Figure 2: Ultrasound Visits for People at Higher and Lower Risk for Complications
Utilization by Age and Risk for Complications
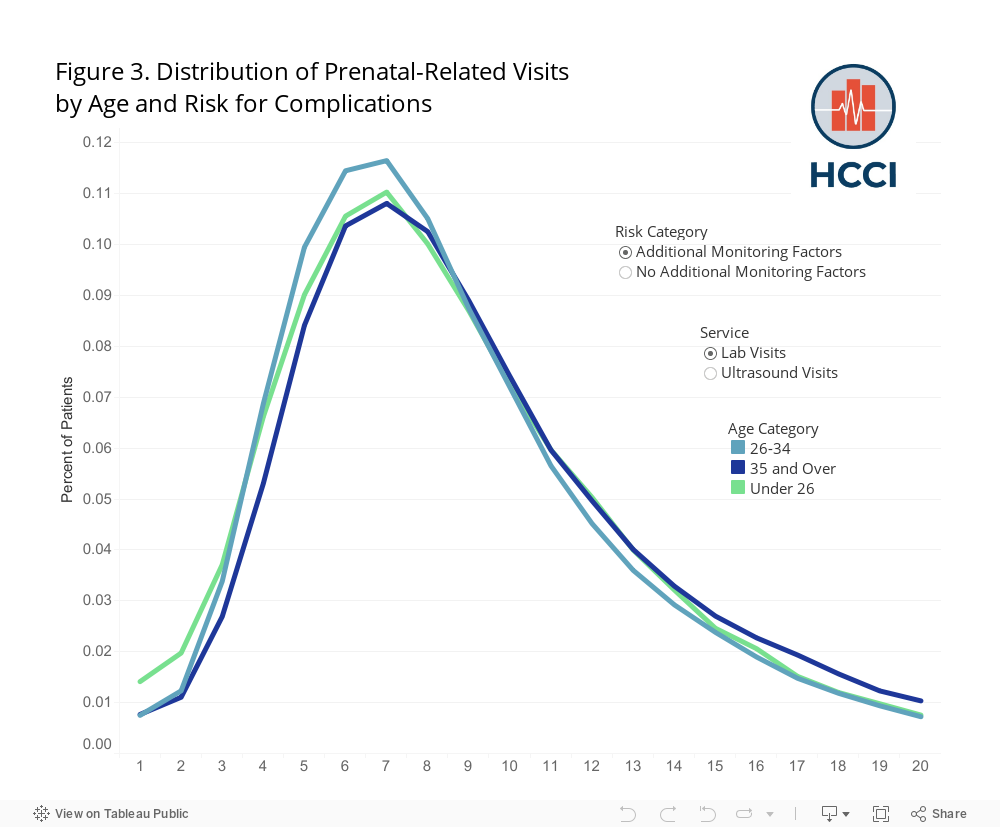
Pregnant people over age 34 at higher risk for complications had the highest average utilization of both laboratory (9.8) and ultrasound (9.1) visits. This suggests that they use laboratory services 15 percent more than all people on average, and they use ultrasound visits nearly 35 percent more. Conversely, people under age 26 without diagnoses indicating they may need additional prenatal monitoring had the lowest average utilization with 7.8 laboratory visits and 4.9 ultrasound visits, on average. Their utilization of laboratory visits is 8 percent lower than all people on average with ultrasound use 27 percent lower.
Figure 3 shows the distribution of laboratory and ultrasound visits by age and risk for complications.
Conclusion
Our analysis finds that, if laboratory and ultrasound visits are indications, pregnant people are receiving a wide range of prenatal services with older pregnant people and those with identified additional monitoring factors using more services, on average. Although we observe differing average visits by age and additional monitoring factors, there likely are other factors contributing to the variation we observe. Future research could look at additional factors, including geography, patient preferences, practice patterns, and benefit design, that may be affecting patterns of how pregnant people are using prenatal services.
Methods Note and Appendix
The Health Care Cost Institute’s dataset of 2.5 billion medical and prescription drug claims for approximately 40 million individuals enrolled in employer-sponsored health insurance across the country offers a unique perspective on what maternal health care costs and the drivers of those costs among the ESI population. Our dataset does not include data on Medicaid, which finances 43% of births in the US. See MACPAC’s Fact Sheet: Medicaid’s Role in Financing Maternity Care. In each year, the HCCI dataset contains between 250,000-350,000 people who had a claim for a delivery.
We study a sample of individuals with employer sponsored insurance (ESI) who had a claim for a delivery (vaginal birth or C-section) within the years of 2009 and 2015. Further classified into individuals with one lab or ultrasound visit based on first and last date of a claim. Patients were required to have coverage for 10 months before the delivery date, resulting in around 1.7 million individuals in the lab visit and ultrasound visit groupings. We analyzed the frequency of medical claims related to a lab test or ultrasound condensed to the first and last date of a claim to act as 1 visit. From our population, we acquired the 100 most frequent CPT codes and distributed them into lab or ultrasound categories. Patient groupings were categorized by age at the date of delivery or monitoring factors indicated by presence of an ex-ante ICD code relating to diabetes mellitus, hypertension, multiple gestation, obesity, and/or previous C-section.
Appendix: Data Table with mean visits by age, additional monitoring factors
| Risk | Age | Mean Laboratory Visits | Mean Ultrasound Visits |
| With/Without Additional Monitoring Factors | All Ages | 8.5 | 6.7 |
| Under 26 | 8.0 | 5.1 | |
| 26-34 | 8.3 | 6.2 | |
| Over 34 | 9.3 | 8.5 | |
| Additional Monitoring Factors | All Ages | 9.3 | 7.7 |
| Under 26 | 9.0 | 6.1 | |
| 26-34 | 9.0 | 7.1 | |
| Over 34 | 9.8 | 9.1 | |
| No Additional Monitoring Factors | All Ages | 8.3 | 6.3 |
| Under 26 | 7.8 | 4.9 | |
| 26-34 | 8.1 | 6.0 | |
| Over 34 | 9.1 | 8.2 |
* All differences statistically significant with p-value < 0.00001