Depression is a common mood disorder that affects how people feel, think, and conduct daily activities. Approximately 17 million adults (1 in 14) had at least one major depressive episode in 2017. Surveys have found that antidepressant prescribing has increased over the past two decades. For example, a 2017 National Center for Health Statistics survey found that, among people age 12 and over, the percent using antidepressants grew 65 percent over a 12-year period.
Recent analysis of Health Care Cost Institute data also indicates antidepressant use increased more quickly than mood disorder diagnoses in our claims data. We find that this trend is consistent across age groups and genders.
To understand trends in antidepressant use, we analyzed prescription drug claims for commercially insured individuals with a clinically diagnosed mood disorder between 2009 and 2017. We did not observe similar increases in antidepressant days supplied among those not diagnosed with a clinically diagnosed mood disorder. In our data, individuals diagnosed with a mood disorder accounted for around 600,000 to 760,000 distinct individuals per year and made up 41 percent to 48 percent of total antidepressant use depending on the year (Appendix Table 1).
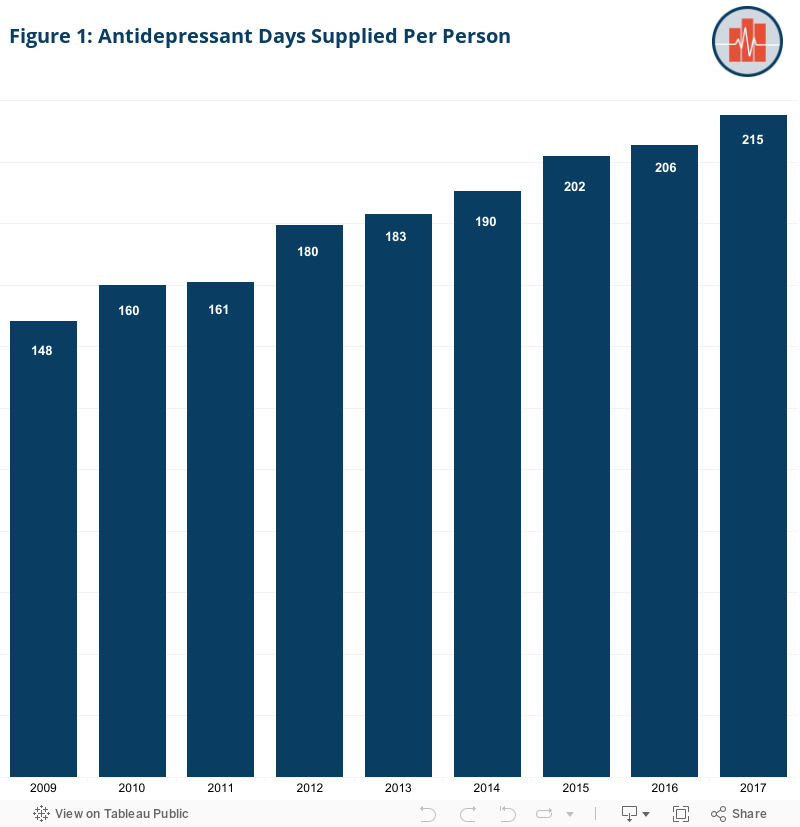
Antidepressant use increased 45 percent from 2009 to 2017 among individuals with employer-sponsored health insurance and a mood disorder diagnosis
Because we wanted to gauge the intensity/volume of prescribing- rather than growth in diagnoses or prescriptions- we calculated the days supplied per person for antidepressants prescriptions. Antidepressant prescriptions were identified using national drug category codes in consultation with a psychiatrist. Days supplied was used for utilization to account for differences in supply and strength per prescription.
We find that, among people diagnosed with a mood disorder, antidepressant days supplied per person increased from 148 (almost five months) in 2009 to 215 (about seven months) in 2017, a 45 percent increase. We looked at the number of active ingredients people were using and did not observe an increase in multiple active ingredients.
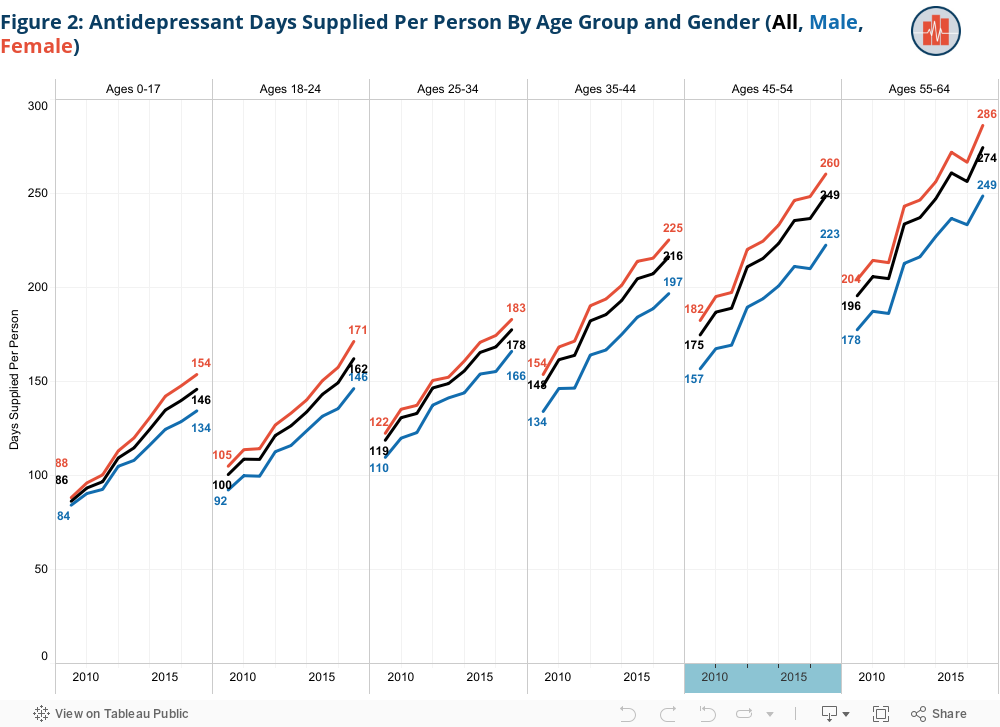
We observed similar trends in antidepressant use across age and gender groups
Age. The National Institute for Mental Health reports that the self-reported prevalence of a major depressive episode decreases with age. Among adults 18-25, 13.1 percent reported an episode in 2017. Nearly eight percent of adults 26-49, and 4.7 percent of adults 50 and over reported a major episode. Although this NIMH survey reports higher prevalence of major depressive episodes in younger adults, we find that older adults were prescribed more antidepressant days supplied. We observed similar increases in antidepressant use from 2009 to 2017 across age groups. Antidepressant days supplied increased:
- 69 percent among ages 0-17
- 61 percent among ages 18-24
- 49 percent among ages 25-34
- 46 percent among ages 35-44
- 42 percent among ages 45-54
- 40 percent among ages 55-64
Gender. The self-reported prevalence of a major depressive episode was 65 percent higher for women than men (8.7 percent compared with 5.3 percent) in 2017. Some estimates suggest that approximately one in eight women will develop clinical depression in her lifetime.
Among the women in our sample, we observe more antidepressant days supplied than men across all age categories. From 2009 to 2017, increases in days prescribed were similar for both men (45 percent increase) and women (45 percent increase).
- The gap in days supplied between women and men was greatest in the 45 to 54 age category. Women had 37.8 more days supplied than men in that age group.
- Between 2009 and 2017, the gap between girls and boys (ages 0-17) grew the fastest – 382 percent over the eight-year period. (From four days supplied in 2009 and 19.3 in 2017.)
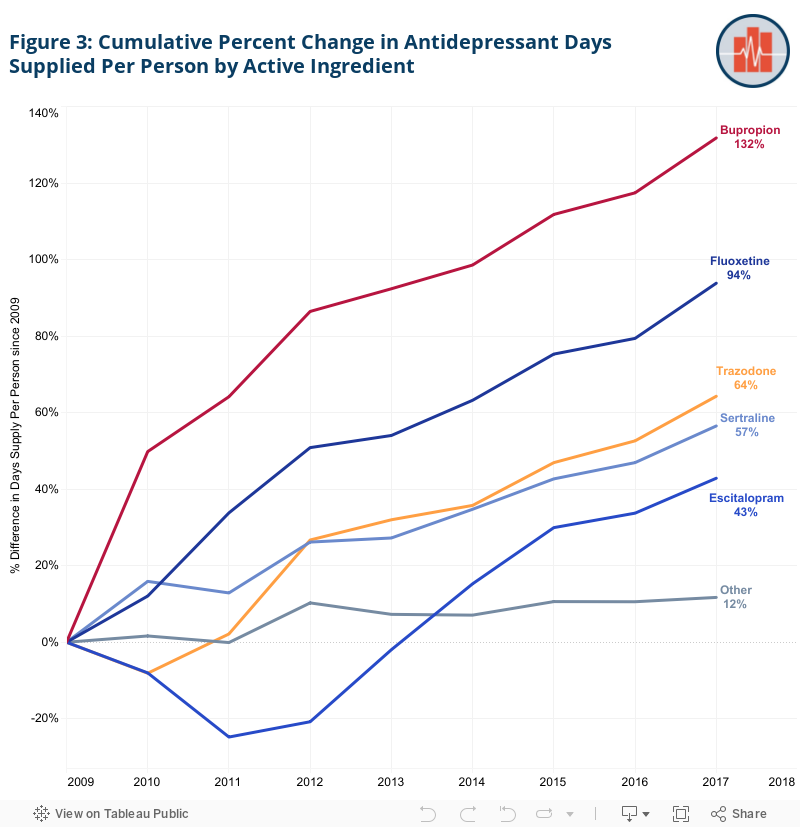
Days Supplied of Bupropion Hydrochloride (Wellbutrin®) Grew Fastest from 2009 to 2017
Of antidepressant active ingredients studied, five accounted for 88 percent of the increase in antidepressant days supplied from 2009 to 2017.
Each of those five active ingredients experienced at least a 40 percent increase from 2009 to 2017:
- Bupropion Hydrochloride (Wellbutrin®): 131.9 percent
- Fluoxetine Hydrochloride (Prozac®): 93.9 percent
- Trazadone Hydrochloride (Desyrel®): 64.3 percent
- Sertraline Hydrochloride (Zoloft®): 56.6 percent
- Escitalopram Hydrochloride (Lexapro®): 42.9 percent
All other active ingredients experienced a combined increase of 11.7 percent.
| Active Ingredient | Days Supplied 2009 | Days Supplied 2017 | Share of the Increase |
| BupropionHydrochloride | 16.29 | 37.77 | 32% |
| FluoxetineHydrochloride | 12.29 | 23.82 | 17% |
| SertralineHydrochloride | 20.44 | 31.99 | 17% |
| EscitalopramOxalate | 19.93 | 28.47 | 13% |
| TrazodoneHydrochloride | 8.39 | 13.78 | 8% |
| All Other(25) | 71.07 | 79.40 | 12% |
| Total | 148.41 | 215.23 | 100% |
The primary purpose of this analysis is to explore antidepressant use trends. While we can not say whether these trends are encouraging or troubling, they do illustrate the value of claims data in understanding prescribing trends over time which, up to this point, has been studied using survey data. We hope this research encourages further exploration of antidepressant prescribing trends.
Methods Note
Sample:We identified patients ages 0 to 64 with employer-sponsored insurance (ESI). The sample was limited to individuals with valid age and gender and enrolled in a preferred provider organization (PPO), health maintenance organization (HMO), point of service (POS), or exclusive provider organization (EPO) plan. All individuals were also required to have 12 months of medical and prescription drug coverage in a commercial plan. To meet the qualifications for the denominator, an individual needed to have at least one claim for the ICD-9 or ICD-10 diagnosis of a mood disorder within a year. The Clinical Classification Software (CCS) was used to determine which ICD codes met criteria for inclusion. This methodology resulted in a sample of 600,000 to 750,000 individuals per year.
Antidepressant Specification:To determine if a specific National Drug Code (NDC) related to an antidepressant, we created a cumulative list of over 9,000 NDC codes using the FDA NDC database in consultation with a psychiatrist. After each NDC was verified as an antidepressant, the NDCs were directly mapped to AHFS categories and active ingredients to group similar NDCs.
Measure of Use:Although days’ supply may vary depending on the quantity of an antidepressant, the decision to use days’ supply was validated by comparing against number of pills and prescriptions filled. All units followed similar trends when compared against each other, which evidences the comparability between common forms of measuring use.
Appendix Table
