

All HCCI Reports
HCCI’s original reports powered by #HCCIdata
-
Effects of vertical integration on providers’ billing and practice patterns in Medicare (2018-2022)
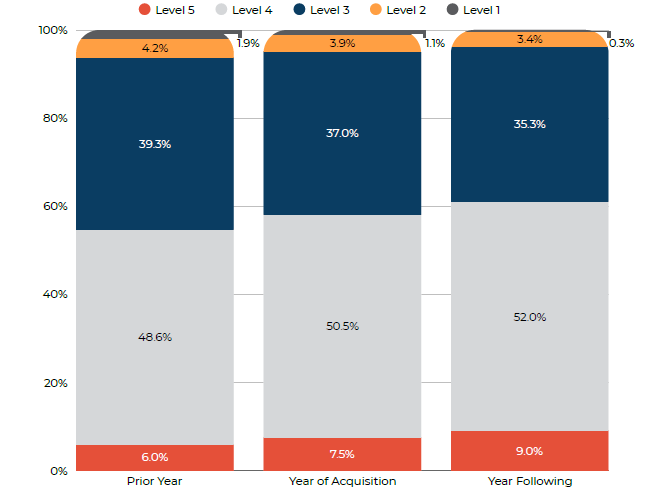 Read more: Effects of vertical integration on providers’ billing and practice patterns in Medicare (2018-2022)
The Health Care Cost Institute (HCCI) in collaboration with West Health created this brief as part of an ongoing series examining how vertical integration is changing provider behavior. In this brief, we extend our previous analysis by using the same panel of physicians acquired by health systems between 2019 and 2021 to examine shifts in…
-
Patterns of Spending by Age in the Commercially Insured Population (2022)
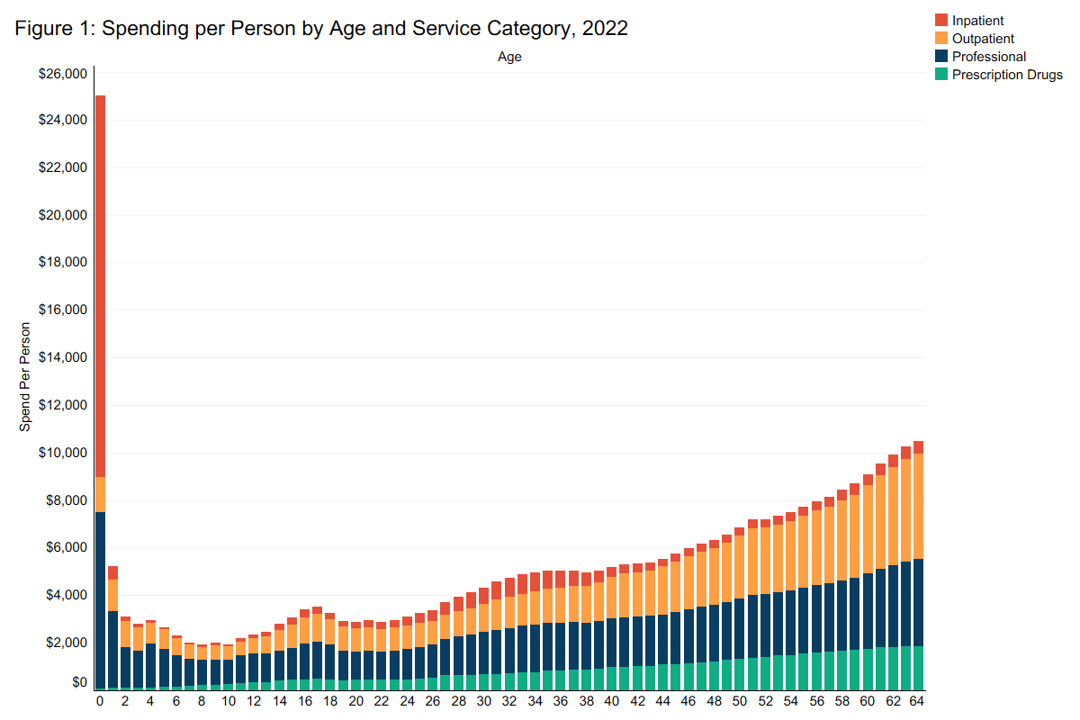 Read more: Patterns of Spending by Age in the Commercially Insured Population (2022)
This brief highlights spending by age and service category in 2022 among people with employer-sponsored insurance (ESI). Key Findings: -Spending per person at $25,000 in the first year of life.-Although overall inpatient spending increases with age, we find different patterns of utilization by age across inpatient service categories.-Although overall outpatient spending increases with age, we…
-
California Health Care Service Spending, Price, and Affordability Variation by County
 Read more: California Health Care Service Spending, Price, and Affordability Variation by County
Introduction Previous research from the Health Care Cost Institute (HCCI) has consistently found that growth in private-sector health care spending is primarily driven by prices. For example, HCCI’s most recent Health Care Cost and Utilization report on employer-sponsored insurance found a 17% increase in per-person spending in California from 2018-2022. In that five-year period, prices…
-
Use of Medications for Opioid Use Disorder Grew from 2018 to 2022, but Remained Low
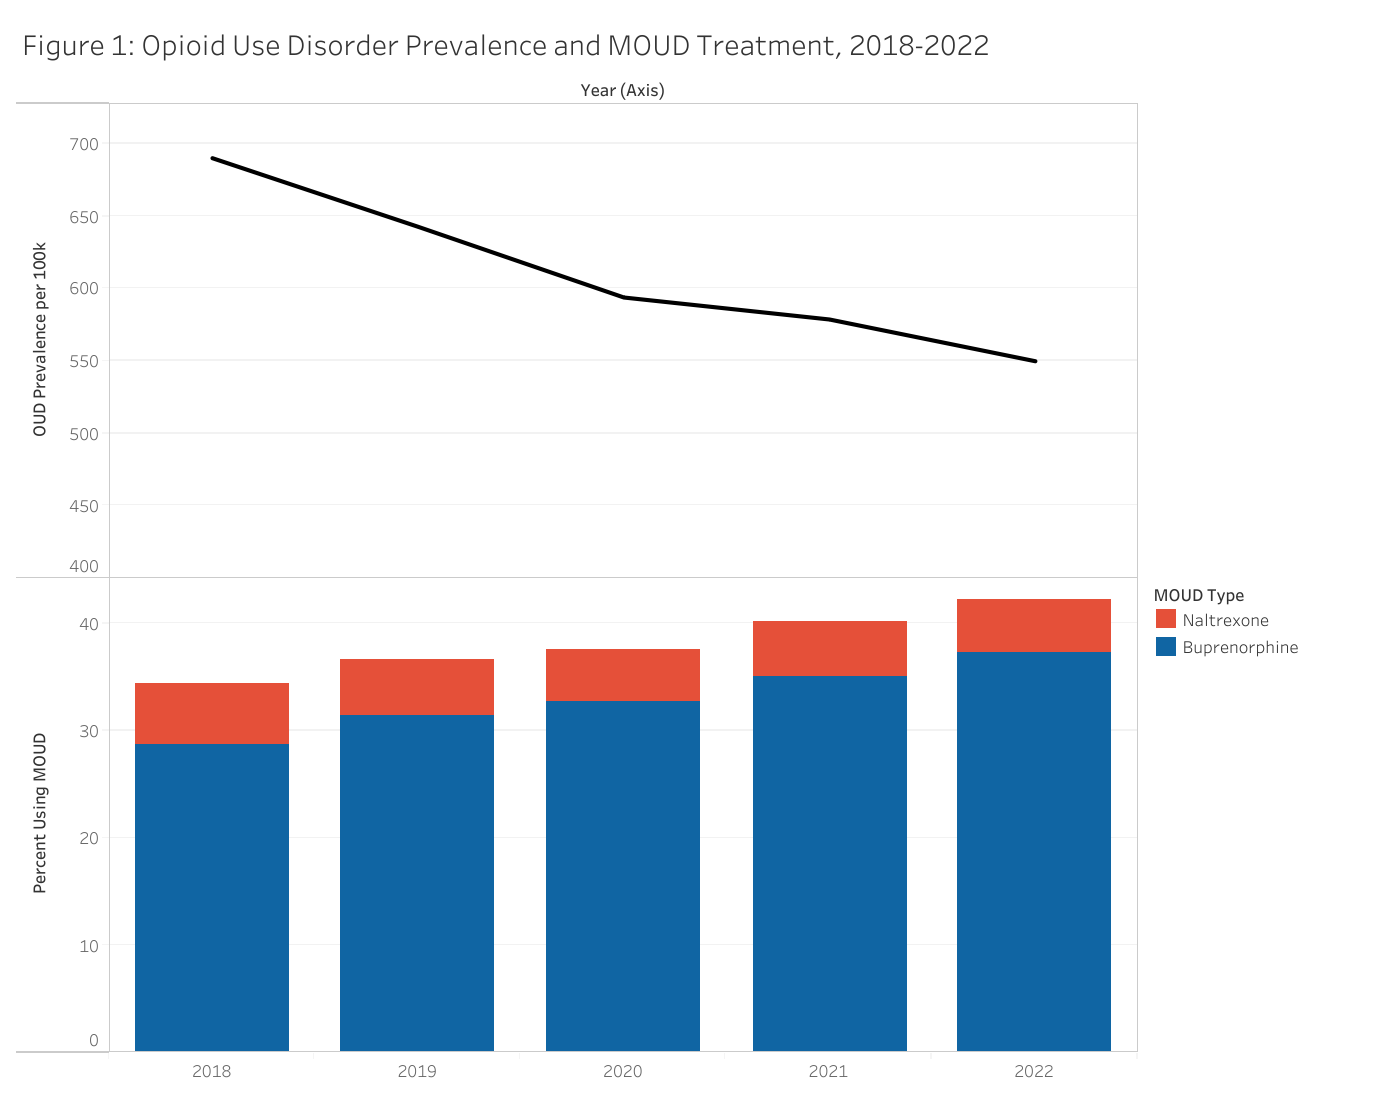 Read more: Use of Medications for Opioid Use Disorder Grew from 2018 to 2022, but Remained Low
Key Takeaways: Nearly one-third of Americans report having a family member who is, or has been, addicted to opioids. While opioid overdose deaths have fallen from their peak in 2022, they are still the most common type of drug overdose death, claiming more than 54,000 lives in 2024. Medications for opioid use disorder (MOUD) are…
-
Most Spending on Imaging Services Went to CT Scans, X-Rays, and Ultrasounds
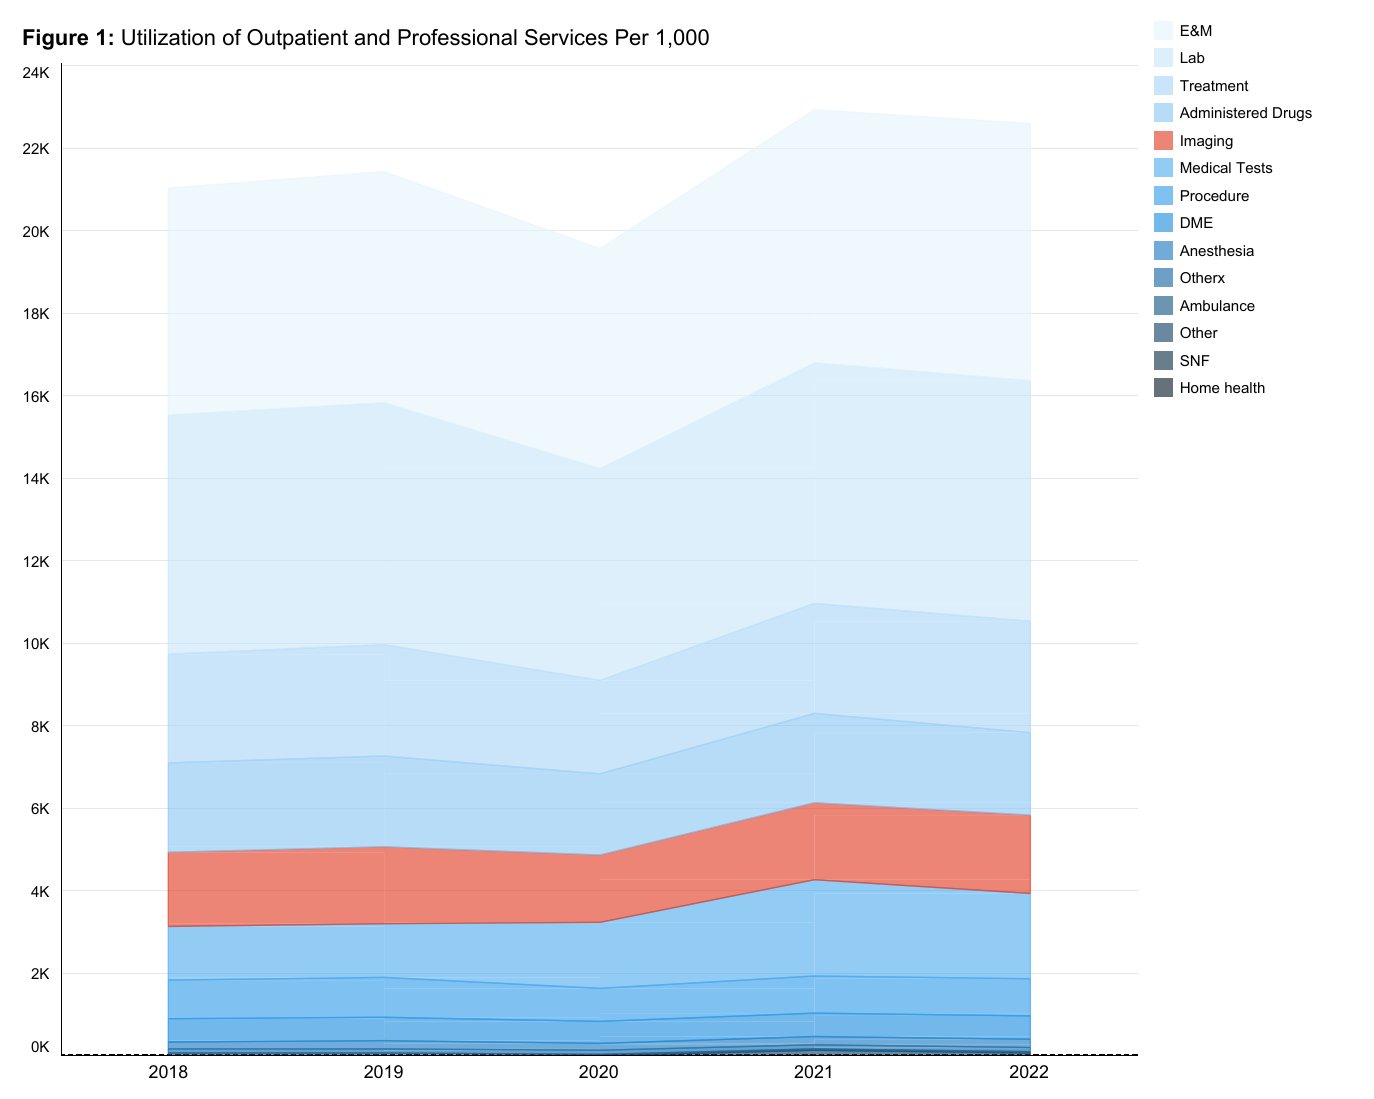 Read more: Most Spending on Imaging Services Went to CT Scans, X-Rays, and Ultrasounds
Imaging services are capturing policy attention because they are central to a wide range of health care services – a critical part of how medical issues are diagnosed and monitored. At the same time, they make up an increasing proportion of outpatient spending and often have higher prices when provided in a hospital outpatient department than in a physician’s office…
-
Inpatient Hospital Prices are Highest Where Hospital Competition is Lowest
 Read more: Inpatient Hospital Prices are Highest Where Hospital Competition is Lowest
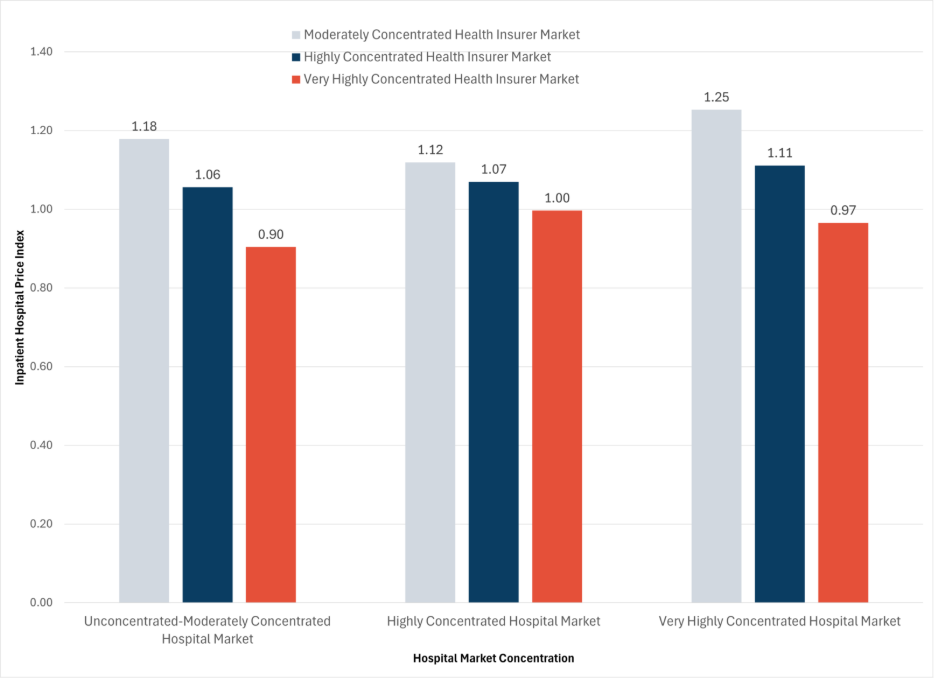
Conventional wisdom and economic theory suggest that more competition means lower prices. In health care, there is longstanding evidence that geographic areas with less competition among hospitals are associated with higher negotiated commercial prices. Regulators and researchers use the Herfindahl-Hirschman Index (HHI) to measure market concentration at a geographic area. HHI can range from 0 (competitive market) to 10,000 (monopoly market). Hospital markets that are considered “highly concentrated,” (HHI greater than…
-
Leveraging Transparency in Coverage (TiC) Data for Health Care Price Analysis
 Read more: Leveraging Transparency in Coverage (TiC) Data for Health Care Price Analysis
The Transparency in Coverage (TiC) regulations have introduced unprecedented visibility into negotiated health care prices in the United States. By requiring insurers to publish machine-readable files containing payer–provider contracted rates starting in 2022, the policy has created a new data source for studying price variation. However, the scale, inconsistency, and missing information within the TiC…
-
Transparency Data Highlight Wide Variation in the Price of Childbirth
 Read more: Transparency Data Highlight Wide Variation in the Price of Childbirth
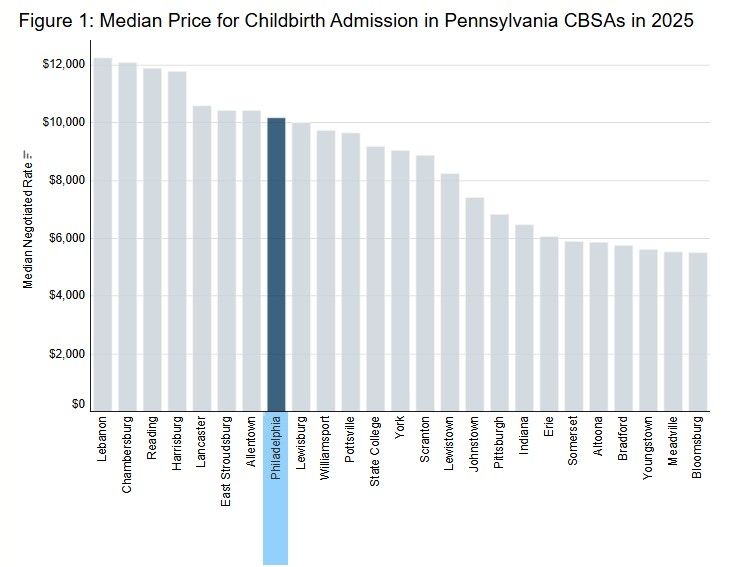
Childbirth is the most common reason for an inpatient hospital admission among people with employer-sponsored insurance. Despite how routine it is, the price of giving birth can vary widely depending on where you live, which hospital you use, and which insurer you have. Using Transparency in Coverage (TiC) data, we set out to better understand…
-
High Medicare Spending on Skin Substitutes Is the Result of Higher Prices, More Patients, and More Products
 Read more: High Medicare Spending on Skin Substitutes Is the Result of Higher Prices, More Patients, and More Products
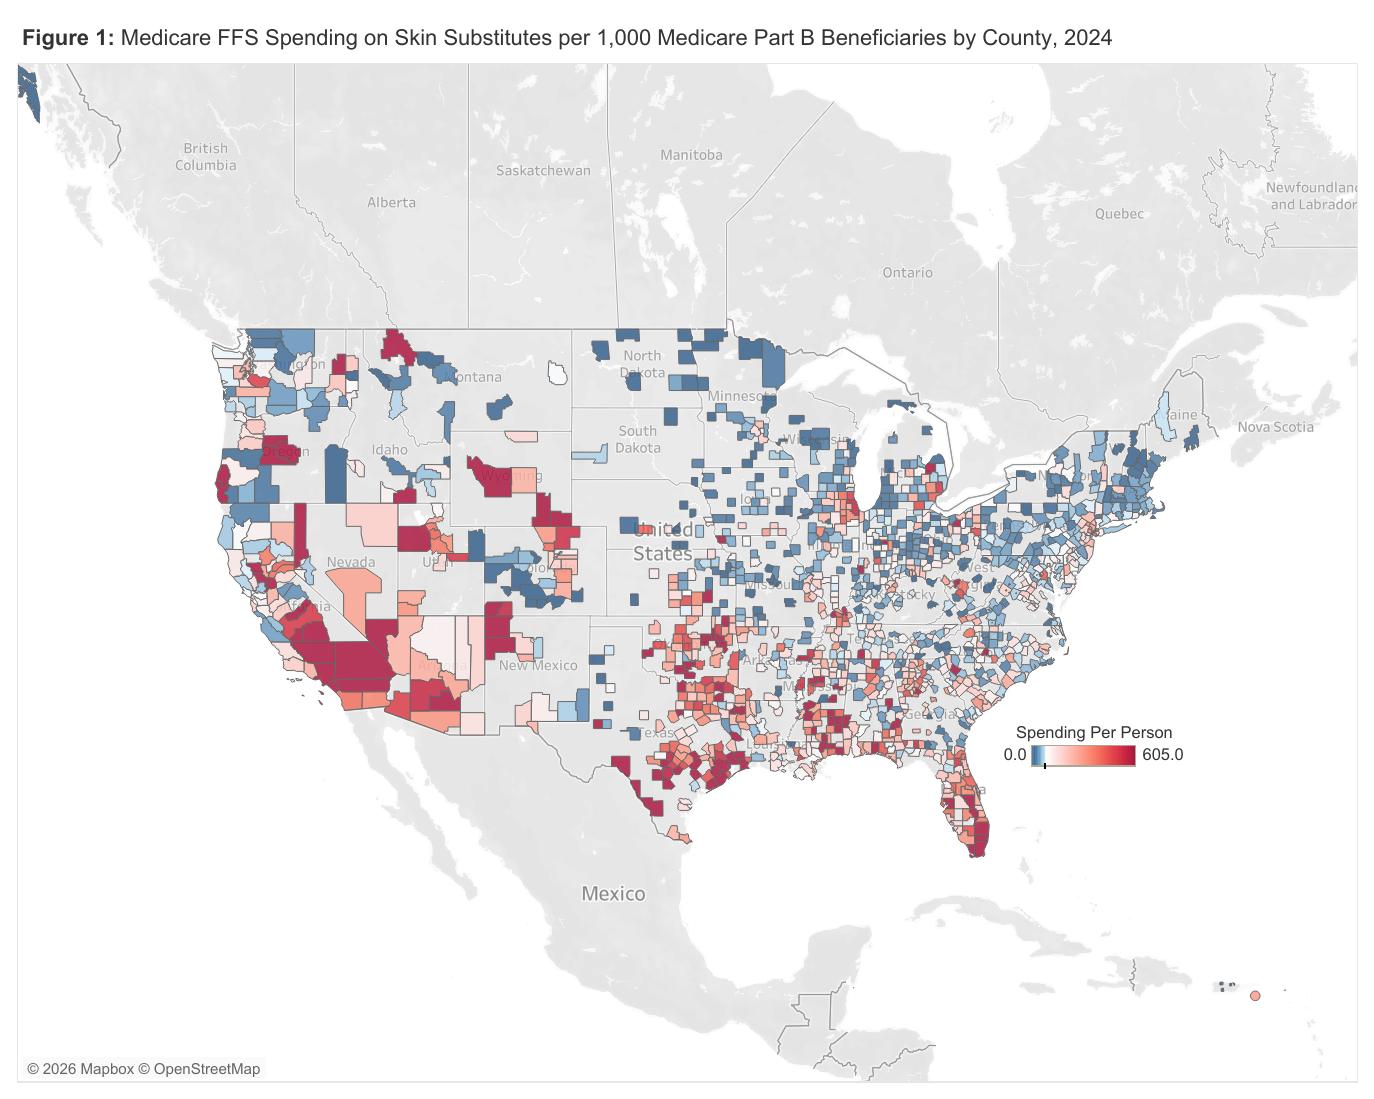
Skin substitutes have gained attention recently for the rapid growth in Medicare Part B spending. Used to replace or regenerate damaged skin, skin substitutes are bioengineered materials or tissue products that mimic the structure and function of healthy skin and can serve as a permanent or temporary solution to conditions like diabetic foot ulcers or burns. …
-
Effects of Vertical Integration on Providers’ Billing and Practice Patterns in ESI (2018-2022)
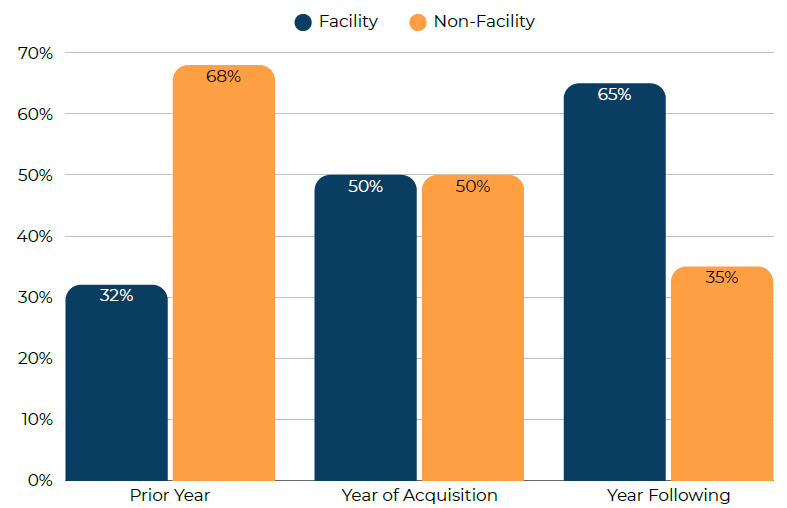 Read more: Effects of Vertical Integration on Providers’ Billing and Practice Patterns in ESI (2018-2022)
In this report, we study changes in billing and practice patterns following providers’ acquisition by health systems, from 2018 to 2022, using HCCI’s unique dataset of people with employer-sponsored insurance. First, we looked at Evaluation and Management (E&M) visits to see if providers that had been acquired billed higher intensity visits following acquisition, which could…