
Conventional wisdom and economic theory suggest that more competition means lower prices. In health care, there is longstanding evidence that geographic areas with less competition among hospitals are associated with higher negotiated commercial prices. Regulators and researchers use the Herfindahl-Hirschman Index (HHI) to measure market concentration at a geographic area. HHI can range from 0 (competitive market) to 10,000 (monopoly market). Hospital markets that are considered “highly concentrated,” (HHI greater than 2,500) generally means that there are a limited number of hospitals or health systems that dominate the market. There also is evidence in the economic literature that geographic areas that have a limited number of insurance companies are associated with lower negotiated commercial prices. These insurance markets are considered “highly concentrated.”
In this cross-sectional analysis of 2022 data, we examine the impact of competition on prices across the US. Specifically, we compared a measure of hospital prices – the inpatient hospital price index from HCCI’s Health Cost Landscape – in areas with varying levels of hospital and insurance company concentration. We focused on inpatient hospital prices because they are most directly related to hospital and health insurance market dynamics.
We find that inpatient hospital prices are the highest in metro areas where hospital markets are very highly concentrated (least competitive) and insurance markets were moderately concentrated (the most competitive among the markets in the Landscape). Inpatient hospital prices in these metro areas were, on average, about 25% higher than the national median in 2022. Inpatient prices were lowest, in contrast, in metro areas where hospital markets were the least concentrated but the health insurer market was highly concentrated. Among metro areas where health insurers are highly concentrated and hospitals are least concentrated, inpatient hospital prices were about 10% lower than the national median.
Figure 1 shows the inpatient hospital price index for moderately concentrated, highly concentrated, and very highly concentrated health insurance markets grouped by how concentrated the hospital market is.
Figure 1. Hospital Inpatient Price Index by Health Insurer and Hospital Market Concentration, 2022
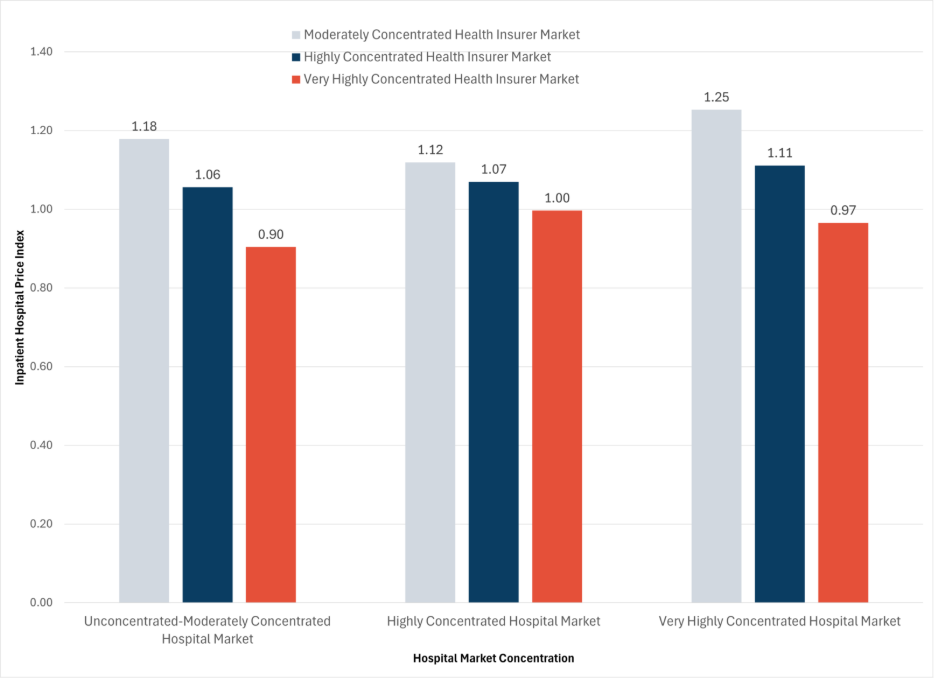
Looking at the most competitive hospital markets, these data indicate that, when there is a moderately concentrated health insurer market, inpatient hospital prices are 18% above the national median. When the health insurer market is highly concentrated, inpatient prices are 6% above the national median, and, when the health insurer market is very highly concentrated, inpatient hospital prices are 10% below the national median.
In the least competitive (very highly concentrated) hospital markets, a moderately concentrated health insurer market is associated with inpatient hospital prices that are 25% above the national median. A highly concentrated health insurer market is associated with inpatient hospital prices 11% higher than the national median, and, when the health insurer market is very highly concentrated, inpatient hospital prices are about 3% below the national median.
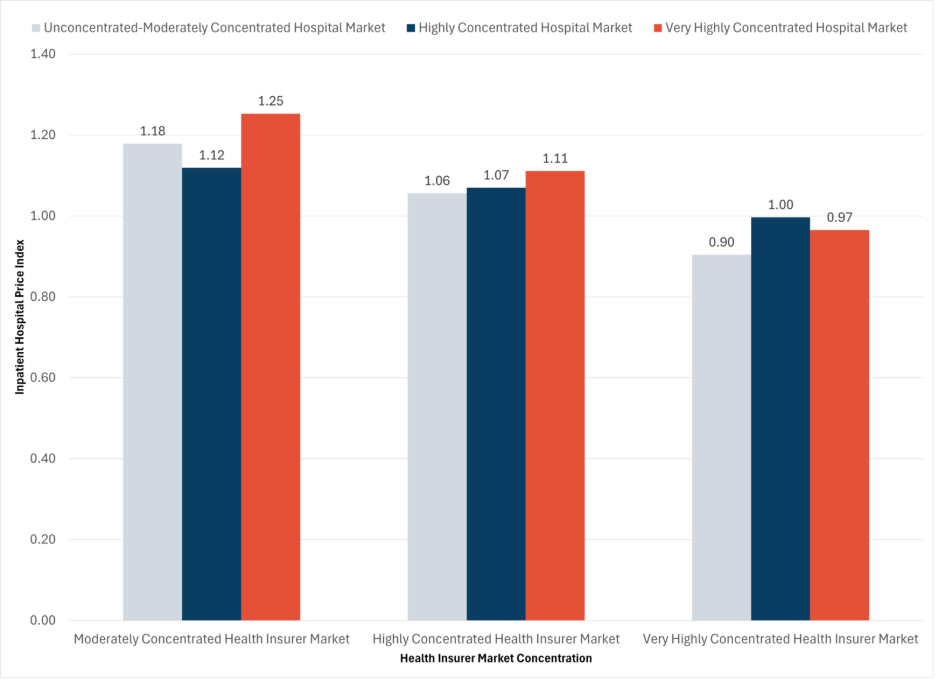
Figure 2 shows the same information but grouped differently. It illustrates the inpatient hospital price index for unconcentrated-moderately concentrated, highly concentrated, and very highly concentrated hospital markets grouped by health insurance market concentration. This chart shows that inpatient hospital prices are lower in markets with a very highly concentrated health insurer regardless of how concentrated the hospital market is in the same metro area.
In very highly concentrated health insurer markets, inpatient hospital prices are 10% below the national median when the hospital market is most competitive (“unconcentrated-moderately concentrated), at the national median when the hospital market is highly concentrated, and 3% below the national median when the hospital market is very highly concentrated.
Figure 2. Inpatient Hospital Price Index by Hospital and Health Insurer Concentration, 2022
The Health Cost Landscape illustrates that how much a person pays for health care is strongly related to where they live. This analysis supports earlier evidence that prices in a given geographic area are related to how competitive those markets are.
Among the more than 250 metro areas included in the Health Cost Landscape, almost 90% have highly concentrated (low competition) hospital markets. More than 70% have highly concentrated (low competition) health insurer markets. As shown in Figure 3, nearly two-thirds of metro areas in the Health Cost Landscape have both highly concentrated hospital and health insurer markets.
Figure 3. Health Cost Landscape Metro Areas by Hospital and Health Insurer Market Concentration, 2022
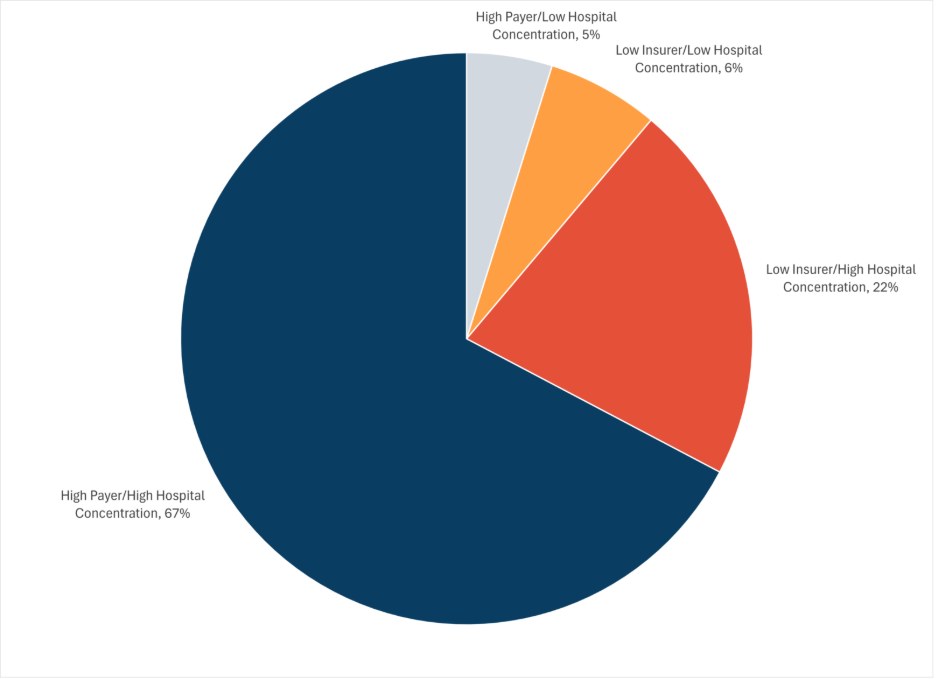
This means that most metro areas have inpatient hospital prices around the national median. Approximately 28% of metro areas likely face inpatient hospital prices above the national median because their markets have low insurer concentration. As Figure 2 shows, markets with moderately concentrated health insurer markets (the most competitive we observe in the data), have inpatient hospital prices above the national median no matter how concentrated the hospital market is. Only 5% of metro areas we studied have markets associated with the lowest inpatient hospital prices (very highly concentrated health insurer markets and unconcentrated-moderately concentrated hospital markets).
As health care prices continue to grow at a rate faster than general inflation, we find in this brief that health insurers can place countervailing pressure on those prices. Highly concentrated health insurer markets were associated with lower negotiated commercial inpatient hospital prices regardless of how competitive the hospital market was in that area.
Consolidation has been increasing across the health care industry and shows no signs of slowing down. Mergers in health care have strong implications for prices, quality of care, care coordination, among others, and this analysis does not capture all of the potential tradeoffs. It also does not address consolidation that occurs through acquisition of physicians by hospitals or hospital systems or of providers by a range of corporate entities. This analysis does highlight one of the more lasting impacts of hospital consolidation – higher prices. It also is a reminder of the importance of policies that promote competition with a goal of putting downward pressure on high and rising health care costs.
Methods
HCCI calculates health care use, prices and spending for 269 metros across the US. See here for the HCL methodology for the price index of interest. Calculation of hospital concentration levels, defined as sum of inpatient admission market shares at corresponding health system level or individual hospital if independent, were based on the AHA’s Annual Data Survey. Health insurance market concentrations were derived from the AMA 2024 report on competition in health insurance. No CBSAs in our 269 metro areas sample had unconcentrated health insurer market. Concentration levels in both health insurers and hospitals were defined as unconcentrated if HHI < 1,500, moderately concentrated if HHI is between 1,500 and 2,500, highly concentrated if HHI is between 2,500 and 5,000; and very highly concentrated if HHI is greater than 5,000.