Previous HCCI analysis documented rapid growth in insulin spending over the 2012-17 period. High out-of-pocket spending may deter adherence to insulin among individuals with diabetes, with potentially fatal effects. In this blog, we update our analysis of out-of-pocket insulin spending to 2019 using HCCI’s unique commercial claims dataset, which includes prescription drug claims for 29 million individuals with employer sponsored insurance coverage.
There has been increasing federal attention on reducing drug prices and affordability, including a pilot program capping Medicare enrollee insulin costs at $35 per month, and a recent federal plan for addressing high drug prices which included increasing affordability of insulin.
In the absence of federal legislation, 15 states have passed bills capping patient out-of-pocket spending on insulin at levels ranging from $25 to $100 for a 30-day supply. Another 22 states have pending legislation to cap insulin spending. State caps apply only to individuals with state-regulated insurance due to the Employee Retirement Income Security Act of 1974, which exempts self-insured plans from state requirements. Thus, these caps exclude the close to 70% of people with employer sponsored insurance who were in self-insured plans in 2020. Federal action would be needed to expand these caps to apply to the full population with employer sponsored insurance coverage.
To inform state and federal considerations around out-of-pocket insulin caps, we examined the percent of individuals with monthly out-of-pocket spending on insulin at a range of thresholds and the distribution of spending within each spending category. We also examined how out-of-pocket spending on insulin has changed over time.
Out-of-Pocket Spending on Insulin in 2019
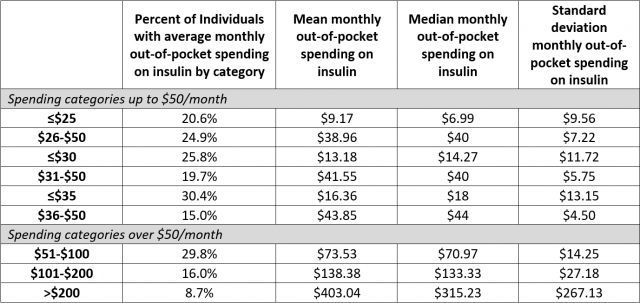
In 2019, 20.6% of individuals in our data had average monthly out-of-pocket spending on insulin below $25, 25.8% had spending below $30, and 30.4% had spending below $35. Thus, if the federal government were to expand the $35 cap on monthly insulin spending beyond Medicare to apply to the commercially insured population, this cap would affect approximately 70% of individuals with commercial insurance (Table).
Close to 30% of individuals in the HCCI sample had average monthly out-of-pocket spending on insulin between $51 and $100, 16% had average monthly spending between $101 and $200, and close to 9% had average monthly spending over $200 (Table). Thus, a $100 monthly cap, which is common among state laws, would affect about 25% of the commercially insured population taking insulin according to our data.
In the full sample, average monthly out-of-pocket spending on insulin in 2019 was $82. The table shows mean and median spending within each spending category. Among the 8.7% of individuals in the highest spending category, the median monthly out-of-pocket spending on insulin was $315.
Table. Average Out-of-Pocket Spending on Insulin in 2019
Out-of-Pocket Spending on Insulin Over Time
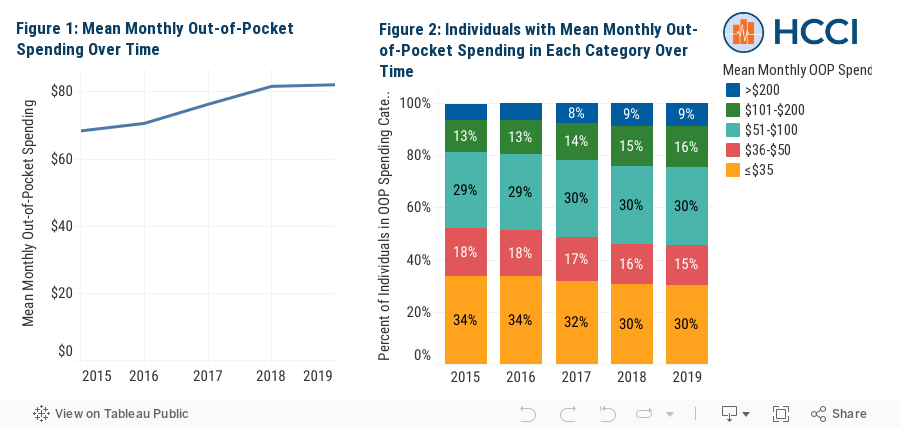
Previous HCCI analyses showed that point-of-sale prices for insulin doubled between 2012 and 2016 and that higher prices were associated with higher out-of-pocket spending on insulin (see here and here). Updated results show that insulin spending continued to rise over the 2015-19 period. Average monthly out-of-pocket spending on insulin in the HCCI sample rose from $68 in 2015 to $82 in 2019 (Figure 1).
The proportion of individuals taking insulin with monthly out-of-pocket spending on insulin below $35 dropped from 34% in 2015 to 30% in 2019 (Figure 2). At the same time, the percent of individuals with average monthly spending over $200 rose from 6% in 2015 to 9% in 2019. Higher average monthly spending may be a result of two factors: first, rising insulin prices, and second, a greater proportion of individuals filling prescriptions for larger supplies, e.g., a 60-day supply vs. a 30-day supply.
To examine the role of supply size, we calculated the distribution of fill days per claim in our data. We found that in 2019, 34.5% of claims were for a fill larger than 30 fill days, compared to 27.7% in 2015. This finding suggests that there is some movement in our sample towards fills of larger amounts over time which may contribute to the growth in the percent of individuals with average monthly spending above $200.
Data Considerations
Rising insulin spending poses a potentially major access challenge for the over 34 million Americans with diabetes. Importantly, our results apply only to people with employer sponsored health insurance. Further, the HCCI data is a subsample of this population; based on the best information available to us, we believe that the racial and ethnic distribution of the population in HCCI’s data is similar to the national employer-sponsored insurance population. Nationally, however, Black and Hispanic populations are under-represented in employer-sponsored insurance, and as such insulin use and spending (and related costs of diabetes care and complications) among these individuals is likely under-represented in our findings. This consideration is especially important given that diabetes disproportionately affects Black, Hispanic, and American Indian/Alaska Native populations and that these populations receive relatively worse quality of diabetes care.
Methods Note
We calculated monthly out-of-pocket spending on fills for prescriptions of all types of insulin products (pulled from the U.S. Food and Drug Administration National Drug Code Directory) using claims data from the Health Care Cost Institute. In Table 1, our sample included individuals enrolled in employer-sponsored insurance coverage for at least one month during calendar year 2019, who were under the age of 65, and filled at least one prescription for insulin during the year. In Figure 1, our sample included individuals enrolled in employer-sponsored insurance coverage for at least one month during calendar years 2015-2019, who were under the age of 65, and filled at least one prescription for insulin during the study period. We did not restrict to individuals with type 1 diabetes.
Out-of-pocket spending is the total amount paid by the patient at the point of sale and includes amounts applied to a deductible, as well as any required co-insurance or co-pay. Average out-of-pocket spending reflects total out-of-pocket spending on all claims filled per member per month for all months in each year.