The Health Cost Landscape is an interactive tool created by the Health Care Cost Institute that uses data from employer-sponsored insurance plans to compare health care spending, prices, use, and service mix across 269 metro areas and 45 states. The Landscape tool shows that health care spending varies widely across the United States, ranging from 70% above the national average in Charleston, WV, to 51% below the national average in Bakersfield, CA.
Per-person spending does not fully capture the impact of health care costs on individual households. The 269 metro areas in the Health Cost Landscape tool vary substantially in income and cost of living, and these factors determine the resources people have available to pay for health care. The Health Cost Landscape tool includes a cost burden index that accounts for both health care spending and income in a geographic area to better highlight differences in how affordable health care is across the country. The cost burden index compares the ratio of per-person health care spending and average household income in a metro area (or state) to the same ratio at the national level to describe the relative affordability of health care.
When combined with data on health spending, the cost burden index helps to complete the picture of health care affordability. The cost burden index is meant to highlight metro areas where health care is expensive relative to the overall economic resources in a community but should not be interpreted as applying to specific individuals or households. Income varies widely across households within each metro area, and lower income households may struggle to afford health care even in “low-cost burden” metro areas. High cost burden indicates that health care costs are high relative to the overall standard of living in an area.
Over Half of All Metro Areas Had Cost Burden That Was Above the National Average
As shown in Figure 1, most metro areas in the Health Cost Landscape tool have a cost burden that is higher than the national average. The average annual health care spending per person across all communities in the Health Cost Landscape tool was $4,724 and the average annual per person income in the United States in 2022 was $66,298. Together, these factors combine to mean that the average cost burden of health care spending is 7.1% of income. Note that $4,724 is an underestimation of per person health care spending because we measure only spending from medical claims and do not include pharmacy spending, over-the-counter medications, or health care paid for without insurance.
Of the 259 metro areas for which we calculated the cost burden index, 42 (16%) have a cost burden within 5% of the national average. 161 (62%) of the metro areas have a cost burden index that is at least 5% above the national average and 66 (25%) metro areas have a cost burden at least 5% below the national average. Charleston, WV, has the highest cost burden at 112% above the national average and Midland, TX, has the lowest at 65% below the national average.

There were roughly equal numbers of states with average, above average, and below average cost burden index values. Figure 2 illustrates each state’s cost burden index, with darker shades representing higher cost burden states where care is less affordable. Of the 46 states with data in the Health Cost Landscape Tool, 14 (30%) have cost burden within 5% of the national average. 16 (35%) have cost burden more than 5% above the national average and 16 (35%) have cost burden more than 5% below the national average. The least affordable states (i.e., those with the highest cost burden) are West Virginia, Alaska, and Wisconsin. Massachusetts, California, and Washington DC have the most affordable care among people with employer-sponsored insurance.

Nearly 30% of Metro Areas Face High Health Care Spending and Low Average Income
The cost burden index is shaped by both average per person health care spending and average household income in a metro area/state. Examining these two factors together can highlight differences in how areas end up with high or low cost burden.
Figure 3. How Health Care Spending and Income Relate to Cost Burden
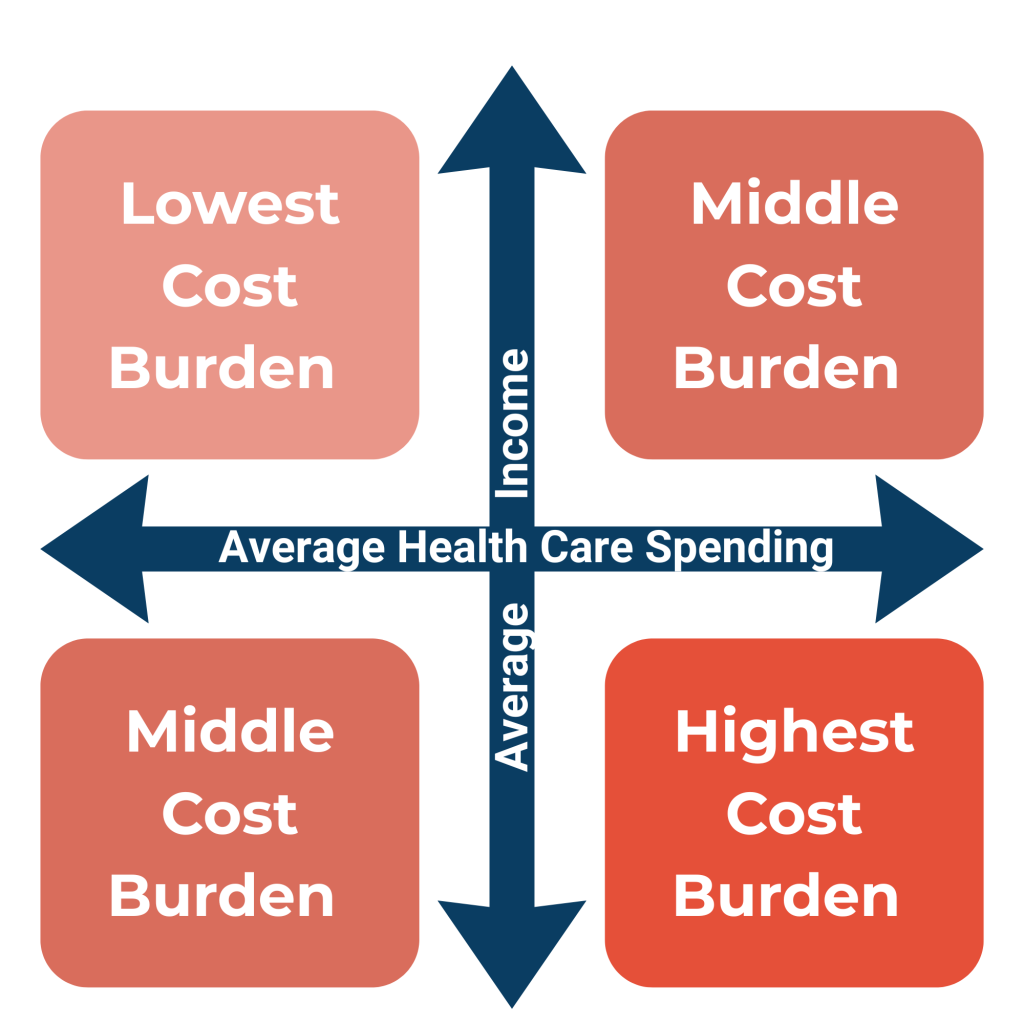
We grouped each of the 259 metro areas into one of four mutually exclusive categories based on their health care spending and average household income. The categories are (1) metros with above average spending and below average income; (2) metros with below average spending and above average income; (3) metros with above average spending and above average income; and (4) metros with below average spending and below average income.
Table 1. High Health Care Cost, Low Income Metro Areas, 2022
| Cost Burden Rank | Health Care Spending | Income | |
|---|---|---|---|
| Charleston, WV | 1 | +70% | -20% |
| Janesville, WI | 3 | +43% | -19% |
| Peoria, IL | 26 | +28% | -13% |
| Fort Wayne, IN | 66 | +11% | -12% |
| New Haven, CT | 156 | +2% | -2% |
Charleston, WV, was both the highest spending metro area and the least affordable, in part because its household income was 20% below the national average, ranking 179th in household income among the metro areas we measured. Janesville, WI, also ranked in the top 10 in both health care spending and cost burden. New Haven, CT, is an example of a metro area that was only slightly above average in spending and below average in income but still falls in the highest cost burden group. Cost burden in New Haven was 4% above the national average, making it one of the seven metro areas with above average health care spending and below average income that were in the in the lower half of the cost burden rankings.
Areas with low health care spending and high income are the most affordable. Across all 259 metro areas, 29 (11%) had below average health care spending and above average income. Table 2 shows a selection of the metro areas in this lowest cost burden group.
Table 2. Low Health Care Cost, High Income Metro Areas, 2022
| Cost Burden Rank | Health Care Spending | Income | |
|---|---|---|---|
| Midland, TX | 259 | -22% | +118% |
| Naples, FL | 255 | -4% | +89% |
| Baltimore, MD | 239 | -17% | +9% |
| Philadelphia, PA | 216 | -0% | +12% |
| Richmond, VA | 197 | -3% | +2% |
Midland, TX, was the most affordable metro area in the Health Cost Landscape, with spending 22% below the national average and income more than double the national average. Naples, FL, is an example of a metro area with low spending and high income that is less of an outlier than Midland. Naples was the 5th least cost burdened metro area in the tool, largely driven by income that was 89% above the national average. Philadelphia, PA, is an interesting case where spending was less than 1% below the national average but income was 12% higher than the national average. Philadelphia ranked 216th in cost burden at 11% below national average. Richmond, VA, was one of the highest cost burdened areas in this group but was still 6% below the national average and ranked 197th out of 259.
The characteristics of the Middle Cost Burden groups are more varied because health care spending and income are pushing the cost burden measure in opposite directions. Table 3 shows metro areas with high health care spending that also have above average household income. There were 28 (11%) metro areas in this category.
Table 3. High Health Care Cost, High Income Metro Areas, 2022
| Cost Burden Rank | Health Care Spending | Income | |
|---|---|---|---|
| Anchorage, AK | 22 | +50% | +7% |
| Burlington, VT | 104 | +19% | +3% |
| Trenton, NJ | 173 | +6% | +5% |
| Minneapolis, MN | 213 | +3% | +15% |
| San Jose, CA | 256 | +24% | +111% |
Anchorage, AK, had the 2nd highest health care spending but also had above average household income. Health care spending in Anchorage was so high that it still ranked 22nd in cost burden, 50% above the national average, despite being a higher income metro area. Burlington, VT, is an example of a high cost, high income metro area that was less of an outlier, with spending 19% above the national average and income just 3% above the national average. Cost burden is lower when health care spending is only slightly above average but income is far above average. Minneapolis, MN, is an example of a metro area with only moderately high health care spending but significantly higher income. San Jose, CA, ranked 4th from the bottom in the cost burden index in the country despite high health care spending. Income is San Jose was more than twice the national average, making it able to sustain health care spending that was 24% higher than national average.
Areas with lower-than-average health care spending and lower-than-average income were the most common type of metro areas in the Health Cost Landscape tool. There were 129 (50%) metro areas in this group. This group included metro areas across the entire spectrum of cost burden, depending on the degree to which low health spending offset low income.
Table 4. Low Health Care Cost, Low Income Metro Areas, 2022
| Cost Burden Rank | Health Care Spending | Income | |
|---|---|---|---|
| McAllen, TX | 12 | -21% | -50% |
| Ithaca, NY | 86 | -6% | -22% |
| Providence, RI | 169 | -1% | -3% |
| Cedar Rapids, IA | 201 | -13% | -7% |
| Tucson, AZ | 244 | -39% | -17% |
McAllen, TX, is an example of a metro area with very low health care spending that is still heavily cost burdened because the household income in McAllen is only half the national average. Ithaca, NY, also shows how low income leads to low health care affordability, even when spending is below average. Providence, RI, and Cedar Rapids, IA, are both in the bottom half of the cost burden rankings because low health care spending was able to offset low income to a sufficient degree to make care more affordable. Tucson, AZ, was among the lowest cost burden metro areas because health care spending was 39% below the national average.
Affordability Continues To Be A Challenge In The Health Care System
Together, the spending and cost burden indices show that, while most metro areas have lower spending than the national average, the majority of metro areas struggle with affordability. Spending alone is not a sufficient measure of health care affordability because lower spending areas may have fewer resources to pay for health care. Addressing high, growing, and highly variable health care spending is critical to making health care more affordable to people with employer-sponsored insurance.
Note: Cost burden is reported for metro areas where Core Based Statistica Area-level average personal income data was available from the Bureau of Economic Analysis. Ten metro areas are excluded due to lack of income data.