
All HCCI Reports
HCCI’s original reports powered by #HCCIdata
-
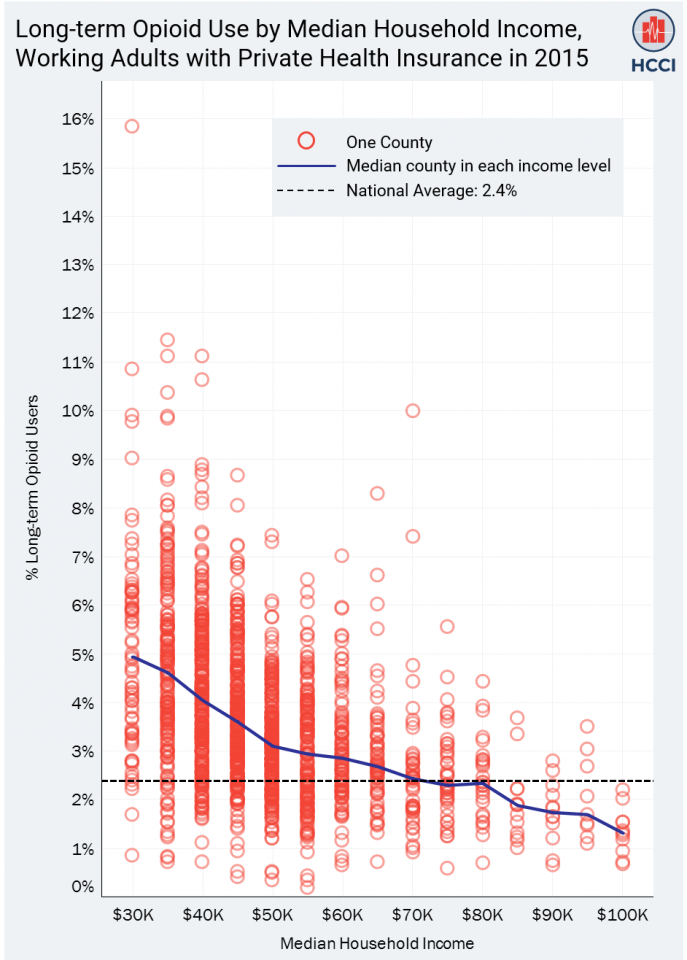
Workers in low income counties more likely to be long-term opioid users
 Read more: Workers in low income counties more likely to be long-term opioid users
Past literature has found links between higher opioid use and local economic conditions for people enrolled in public health programs, but there has been little discussion of whether this relationship occurs among the privately insured. Using HCCI claims data and county level income data from the US Census Bureau, we examined how a county’s median…
-
Health Affairs: Understanding Health Spending – Lessons From The Healthy Marketplace Index
 Read more: Health Affairs: Understanding Health Spending – Lessons From The Healthy Marketplace Index
HEALTH AFFAIRS BLOG: “As policymakers consider actions to address challenges with the Affordable Care Act and ongoing growth in health spending, the importance of understanding local health care market dynamics is more important than ever. Traditionally, policy makers and other stakeholders have evaluated commercial health care markets’ total spending and often attributed high spending to…
-
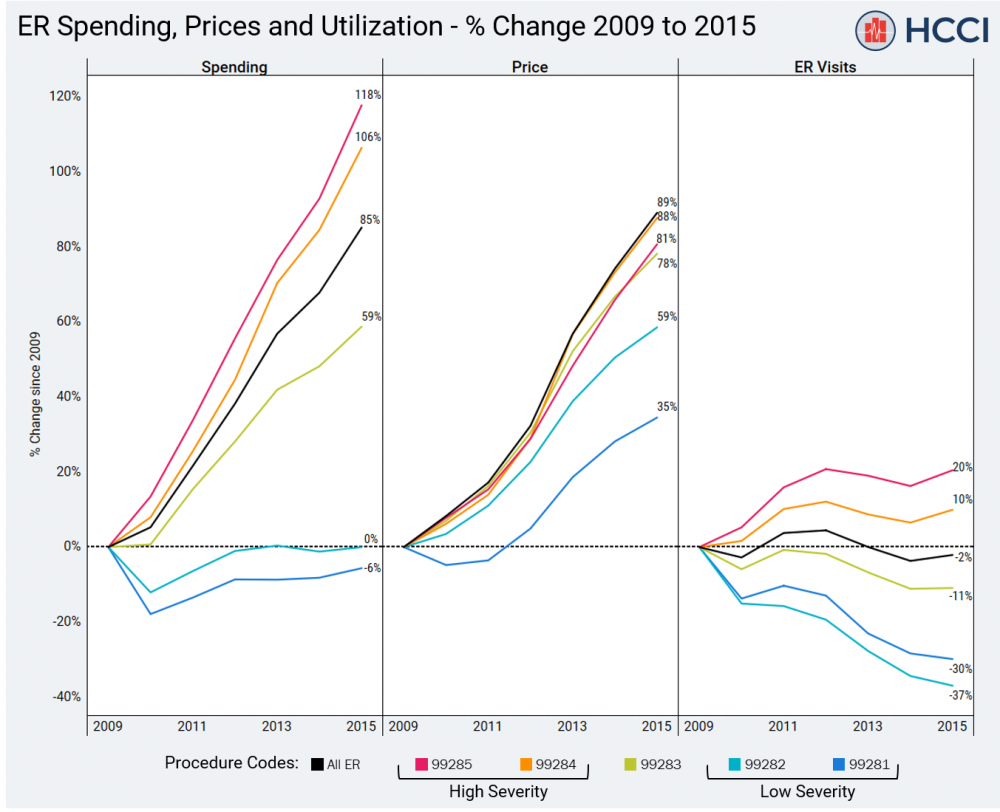
ER spending increased 85%, driven by price increases for the most severe cases (2009-2015)
 Read more: ER spending increased 85%, driven by price increases for the most severe cases (2009-2015)
Medical bills from the Emergency Room (ER) are a mystery to many patients in the US health system. From incredibly high, varying charges to surprise bills resulting from in/out of network confusion, many Americans have no idea what to expect when it comes to the cost of this necessary service. Recently, Vox reporter, Sarah Kliff,…
-
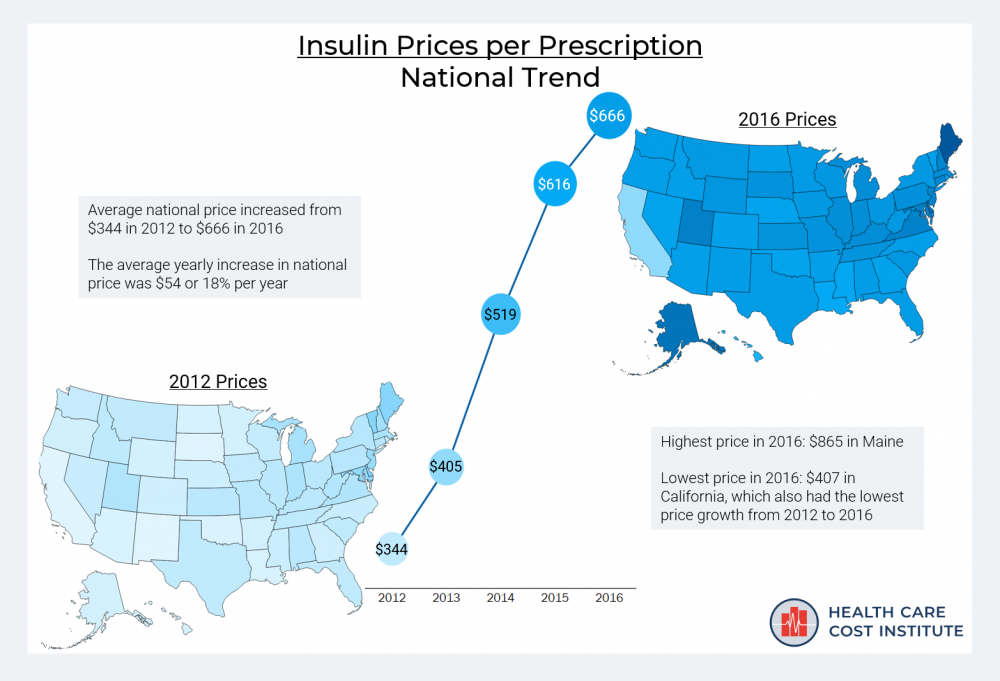
Price of insulin prescription doubled between 2012 and 2016
 Read more: Price of insulin prescription doubled between 2012 and 2016
In honor of National Diabetes Month, our inaugural blog post focuses on a topic of particular interest to people with diabetes: the price of insulin. Insulin is the hormone responsible for the body’s ability to use sugar and prevent dangerously high and potentially deadly levels of blood sugar. Diabetics are unable to make enough insulin…
-
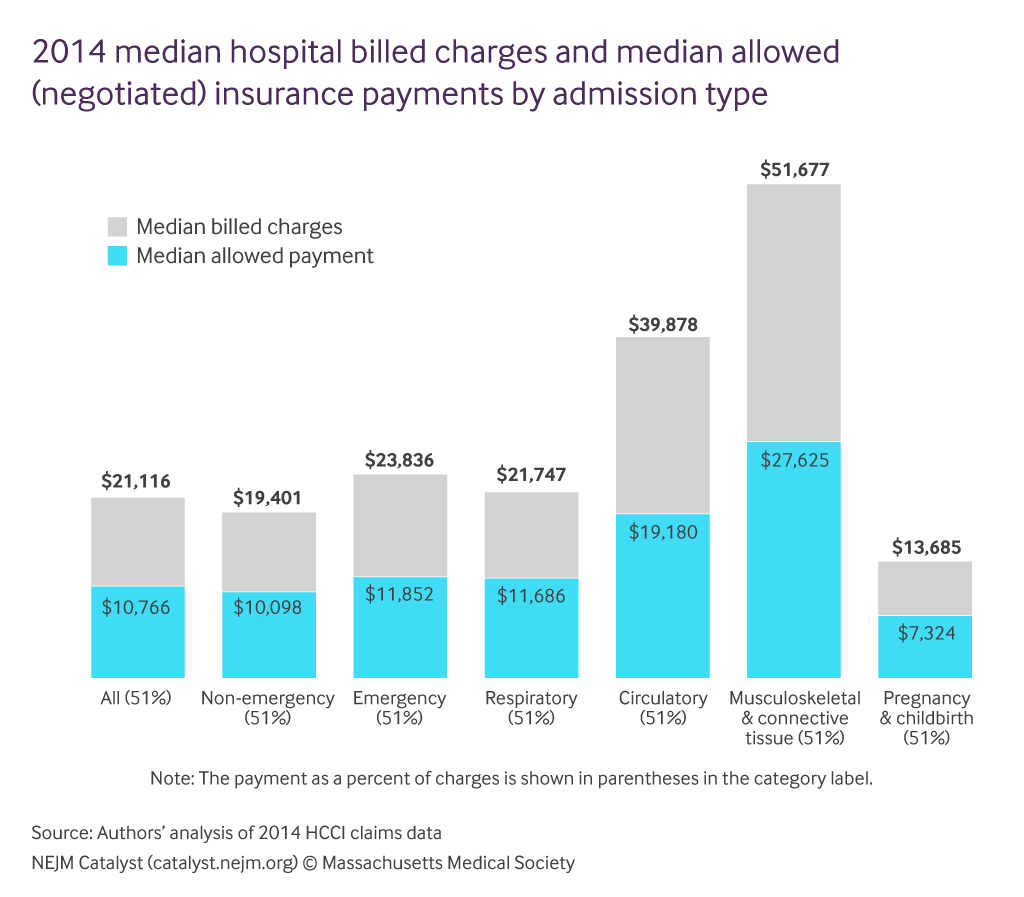
New England Journal of Medicine: The Value of Health Insurance through Price Discounts
 Read more: New England Journal of Medicine: The Value of Health Insurance through Price Discounts
NEJM CATALYST: “As context for the ongoing health care reform debate, we analyzed Health Care Cost Institute (HCCI) data. HCCI is a nonpartisan, nonprofit organization aimed at providing complete and accurate information about health care utilization and costs in the United States. Our goal was to demonstrate the value of insurance through these discounted rates….
-
Health Affairs: Medicare Competitive Bidding Program Realized Price Savings For Durable Medical Equipment Purchases
Read more: Health Affairs: Medicare Competitive Bidding Program Realized Price Savings For Durable Medical Equipment PurchasesABSTRACT: From the inception of the Medicare program there have been questions regarding whether and how to pay for durable medical equipment, prosthetics, orthotics, and supplies. In 2011 the Centers for Medicare and Medicaid Services (CMS) implemented a competitive bidding program to reduce spending on durable medical equipment and similar items. Previously, CMS had used…
-
Trends in Total and Out-of-Pocket Spending in Metro Areas: 2012-2015
Read more: Trends in Total and Out-of-Pocket Spending in Metro Areas: 2012-2015This data brief examines geographic variation in health care per capita spending, with a focus on consumer per capita out-of-pocket spending across geographies (2012-2015). It also explores whether the proportion of people enrolled in consumer-directed health plans (CDHPs) and the proportion not utilizing health care services had any influence on out-of-pocket spending.
-
Non-Shoppable Health Care Services: Inpatient Hospitalizations
Read more: Non-Shoppable Health Care Services: Inpatient HospitalizationsThis data brief reports on spending and utilization in populations likely unable to shop for a hospital prior to seeking care, comparing spending and length-of-stay for individuals who were admitted through the emergency department (ED) to that of individuals who needed ambulance services the day of their admission through the ED.
-
JAMA Internal Medicine: A Perspective on Out-of-Pocket Spending
Read more: JAMA Internal Medicine: A Perspective on Out-of-Pocket SpendingTo the Editor Understanding out-of-pocket spending is critical to understanding health care costs in the United States. We applaud the efforts of Adrion et al as an important contribution to understanding the out-of-pocket spending of the commercially insured population younger than 65 years. The commercially insured comprise over 50% of the nonelderly US population and, as…
-
Medicare Advantage Health Care Utilization – Observation Stays
Read more: Medicare Advantage Health Care Utilization – Observation StaysThis data brief reports on outpatient observations stays in the Medicare Advantage population from 2010 through 2014. The results show that the rate of observations stays increased in total as well as following hospitalizations.