In HCCI’s Health Care Cost and Utilization Report (HCCUR), we report per person spending on health care services of $5,607 in 2020. Of this spending, $1,514 (27%) was on services that occurred in a hospital outpatient setting and $1,071 (19%) was on services that occurred in a hospital inpatient setting. These spending amounts do not include spending on professional services that a patient receives while they are in the hospital (i.e., payments made to physicians and other clinicians who provide services to hospital patients).
Spending on in-hospital, professional services is instead captured in the $1,743 (31%) of total spending reported as “professional.” The professional category of spending also includes spending on physician and other clinician services provided outside of hospitals, e.g., in doctor’s offices. Therefore, to estimate total hospital spending, we must combine the hospital-based professional payments from the professional category and the “facility” payments, which are captured by the inpatient and outpatient spending reported above.
In this HCCUR Data Point, we use the HCCUR Downloadable Data available on HCCI’s website to divide professional spending into spending on services in facility vs. non-facility settings (e.g., hospitals vs. physician offices). For the most part, “facilities” as we define them here refer to hospitals; we identify facility-based services based on place of service of where care was rendered (e.g., outpatient department, emergency room, or skilled nursing facility).
This analysis allows us to (1) Add the professional spending that occurs in hospitals to the facility spending captured in the HCCUR inpatient and outpatient categories to estimate total hospital spending, and (2) Track physician spending over time across hospital and non-hospital sites of care.
Combined Professional and Facility Spending per Person on Hospital Care in 2020 was $3,119 or 56% of Total Spending
For most hospital-based services (inpatient and outpatient), a patient will receive a bill from the hospital (“facility” payment) and from the physician(s) and other clinicians providing services (“professional” payment). To estimate total spending on hospital care—including facility and professional spending—we add the amount spent per person on professional services provided in hospitals to the facility spending reported in HCCUR’s inpatient and outpatient categories.
As shown in the Table below, in 2020, average per person spending on inpatient care was $1,071, average per person spending on outpatient care was $1,514, and average per person spending on professional services provided in facilities (the vast majority of which are hospitals) was $534. Adding these together, we estimate that average total per-person spending on hospital services was $3,119 in 2020, up from $2,931 in 2016.
Over the 2016-2020 period, therefore, total hospital spending, including facility and professional spending in inpatient and outpatient departments, made up around 57% of total per person spending across all categories of services (inpatient, outpatient, professional, prescription drugs).
| Table. Facility, Professional, and Total Spending per Person on Hospital Services, 2016-2020 |
| 2016 | 2017 | 2018 | 2019 | 2020 | |
| Inpatient Facility | $1,016 | $1,030 | $1,089 | $1,123 | $1,071 |
| Outpatient Facility | $1,408 | $1,476 | $1,585 | $1,659 | $1,514 |
| Hospital Professional | $507 | $517 | $530 | $539 | $534 |
| Total Hospital | $2,931 | $3,023 | $3,204 | $3,322 | $3,119 |
| Total Spending per Person Across All Categories | $5,147 | $5,304 | $5,606 | $5,834 | $5,607 |
| HospitalSpending as a Percent of Total Spending per Person | 57% | 57% | 57% | 57% | 56% |
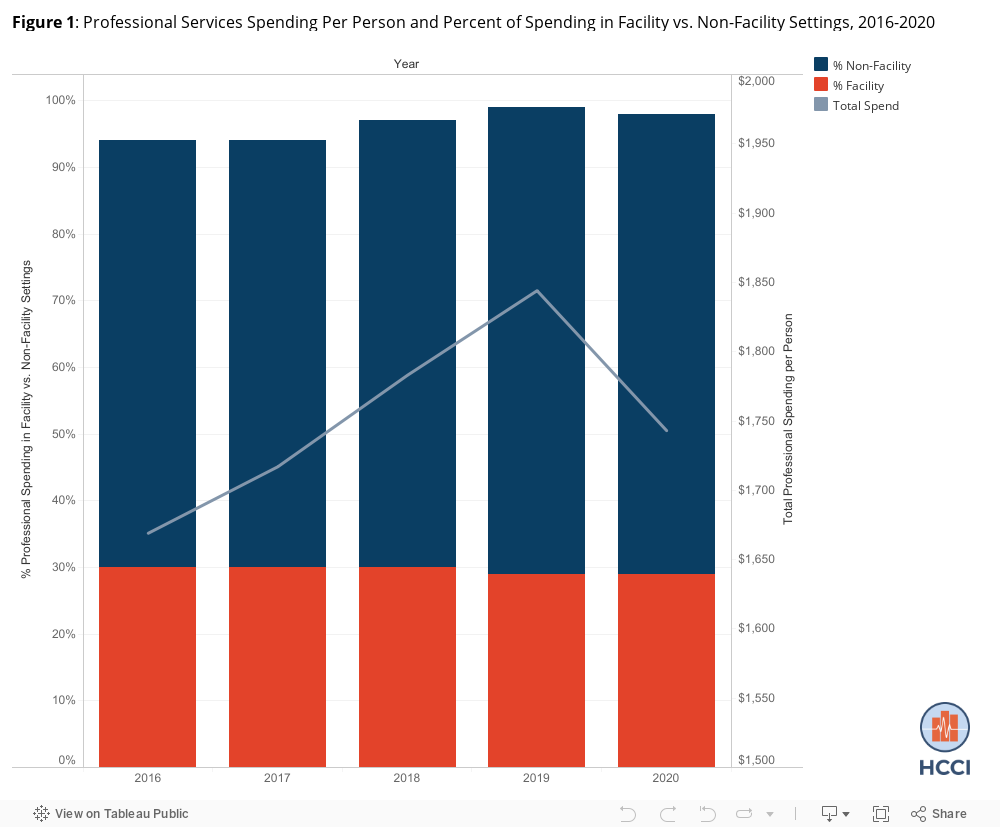
About 30% of Professional Spending Occurred in Facilities over 2016-2020
Of the total professional spending per person of $1,743 in 2020, $534 (31%) was for facility-based services, as reported above. Just over $1,200 (69%) was for physician/clinician services in non-facility settings (e.g., physician offices); the remaining spending was not attributable to either a facility or non-facility. The percent of professional spending on services in facilities has remained stable at about 30% since 2016 (Figure 1).
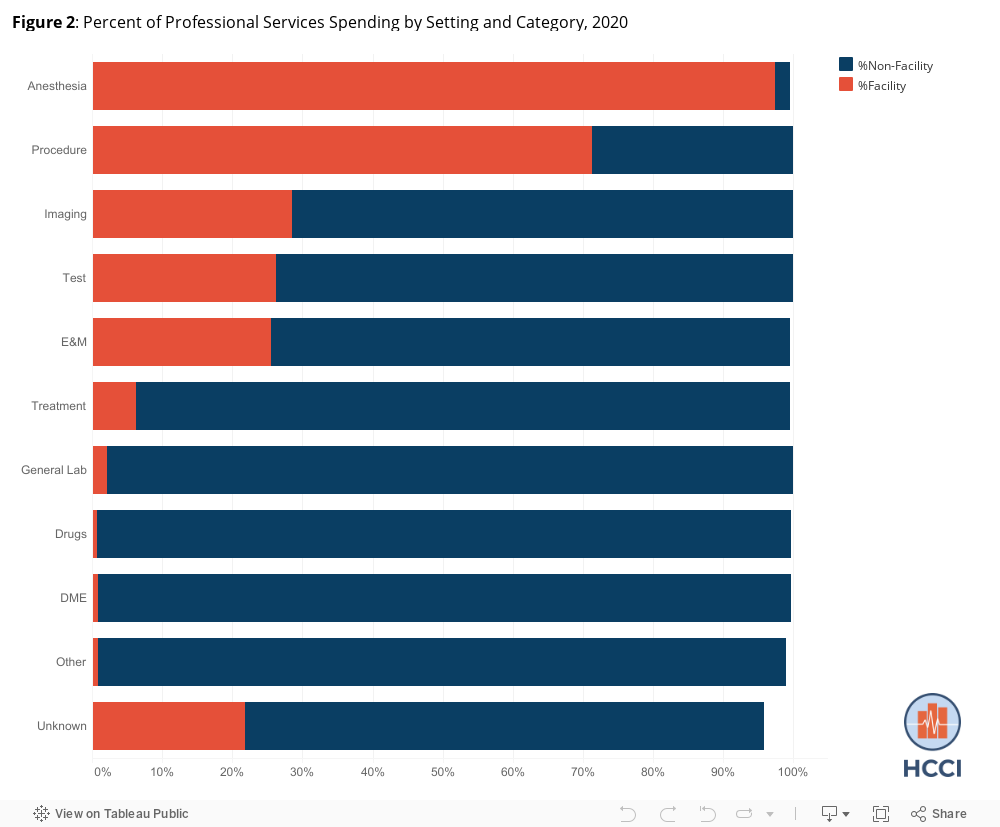
The percent of spending on professional services that occurred in facilities varied substantially across categories of professional care (Figure 2). For example, nearly all (98%) of spending on professional anesthesia services occurred, as we might expect, in facilities. In contrast, only 1-2% of professional spending on durable medical equipment (DME), drugs, and labs occurred in facilities. Just under 30% of evaluation and management (E&M) and imaging professional services occurred in facilities (facility-based E&M services are largely those provided in emergency departments), compared to just over 70% of spending on professional services associated with procedures.
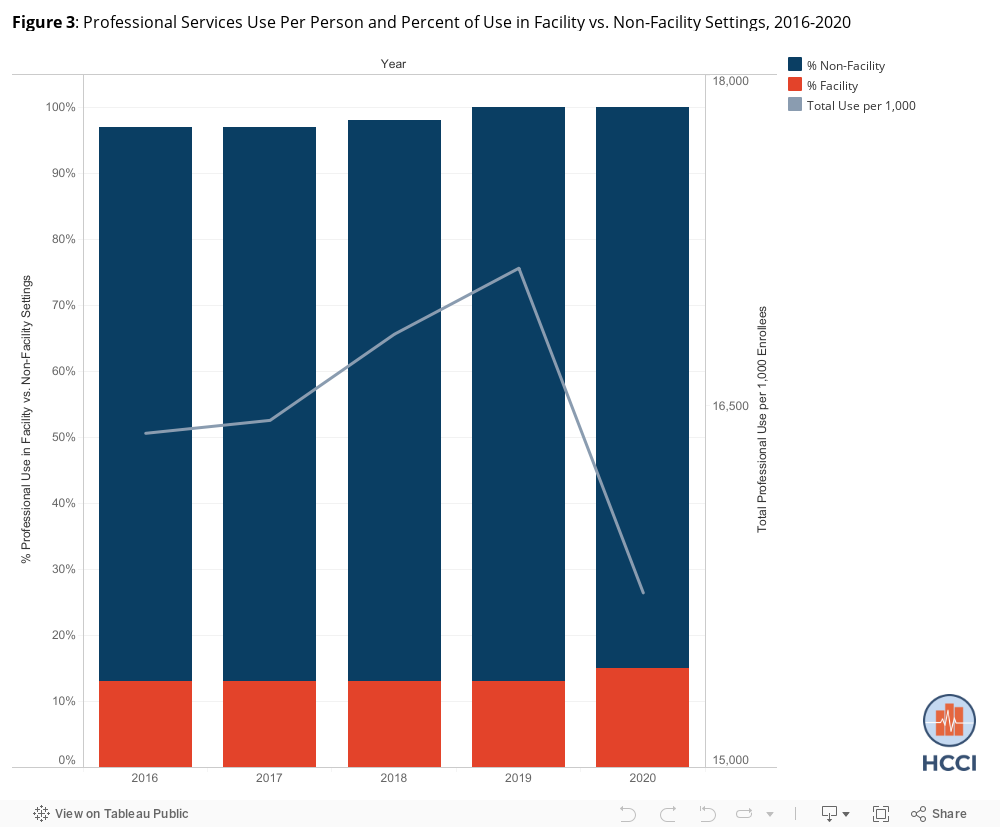
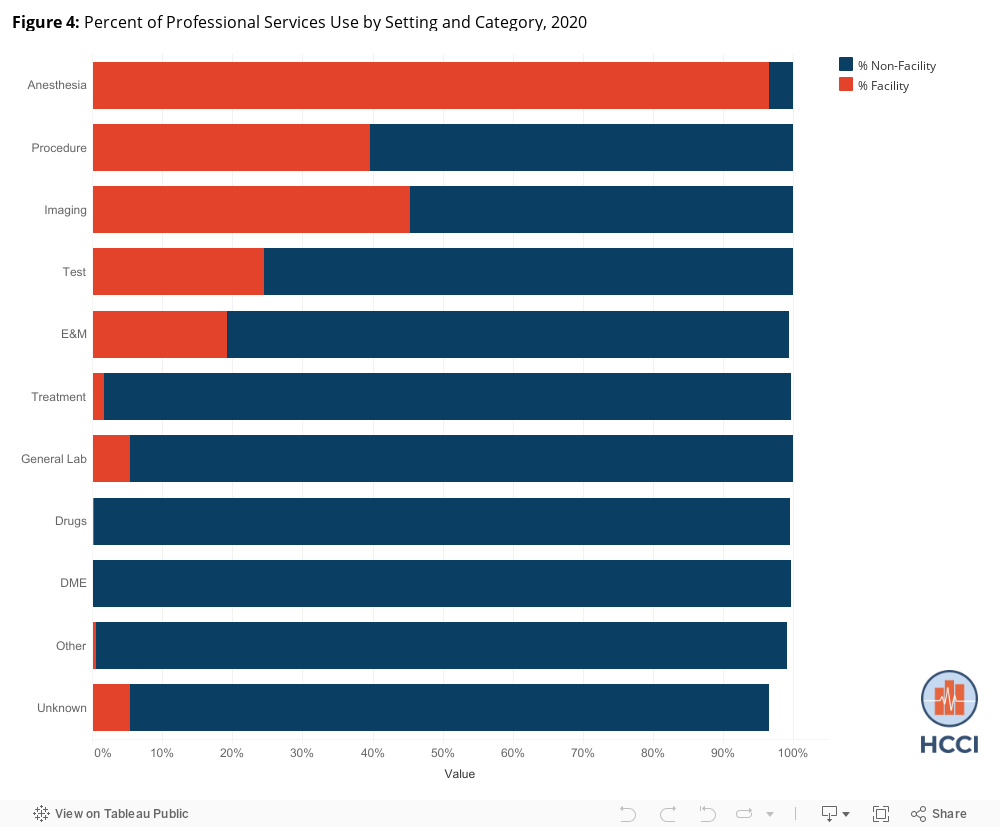
Of professional services (i.e., volume of visits), 15% occurred in facilities overall with the remaining majority of services provided in non-facility settings (Figure 3). The categories with highest proportion of professional services provided in facilities were anesthesia (97%), imaging (45%), procedures (40%), and tests (24%) (Figure 4).
HCCI Data Supports Policy Efforts to Monitor Physician and Hospital Spending
HCCI’s public HCCUR data allows policymakers, advocates, researchers, and other users to monitor spending on and use and prices of physician services in hospitals and in non-hospital settings such as offices and telehealth. Further, these data allow for more comprehensive tracking of spending on hospital services by allowing the addition of facility-based spending and professional spending to estimate the full cost of these services.
Hospital prices have been the target of most policy efforts to lower prices to date (e.g., capping hospital prices in the state employee plans in Montana and Oregon, targeting high-priced hospitals or health systems in Massachusetts, global budgets for hospital spending in Maryland), however there is increasing interest in monitoring and lowering prices associated with physician spending. Comprehensive, longitudinal data on prices for physician services across settings are a foundation for these efforts.