The pandemic of a new coronavirus, COVID-19, is increasing demand on hospitals as unprecedented numbers of people with respiratory disease seek treatment. In addition to straining hospital resources directly related to care of COVID-19, the outbreak may also displace other types of care. In this analysis, we hope to inform the understanding of the distribution of care provided in hospitals and how it may be affected by the current public health crisis.
We describe utilization, length of stay, price per admission, and average price per day as metrics of how hospital resources are distributed among types of admission – the reason people stayed in the hospital overnight. In 2018, 7.9 percent of people in the U.S. had an overnight hospital stay. That included 9.5 million individuals under 65 with private health insurance. Understanding how individuals under age 65 with private insurance use the hospital can provide valuable baseline understanding as the current unique circumstances necessarily change the distribution of hospital resources.
Using data from HCCI’s annual Health Care Cost and Utilization Report, we focus on the subset of individuals under 65 who receive health insurance coverage through an employer. In recent years, spending on inpatient admissions for this group was approximately 20 percent of total health care spending. The underlying data are available for download here.
Reason for Admission
One of the most basic ways to understand how hospital resources are used is to assess why people are admitted to the hospital in the first place. Using 2018 as a baseline, we examine the kind of care hospitals typically provide. We categorize inpatient hospital admissions by the type of services delivered – labor/delivery/newborns, medical, surgical, mental health, and substance use – as well as primary diagnosis.
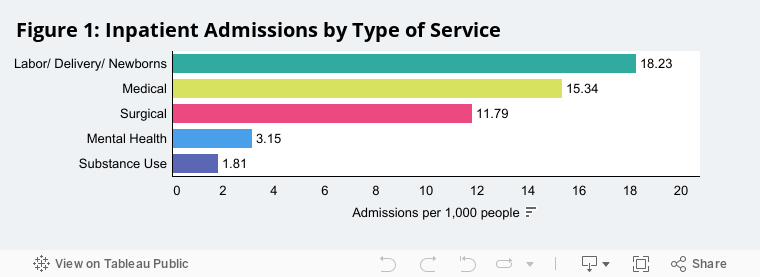
In 2018, labor/delivery/newborns was the most common type of admission for those with employer-sponsored insurance, accounting for more than 18 admissions per 1,000 (Figure 1). Medical and surgical admissions followed with more than 15 and nearly 12 admissions per 1,000, respectively. Mental health and substance use interventions made up the smallest share of inpatient admissions in 2018.
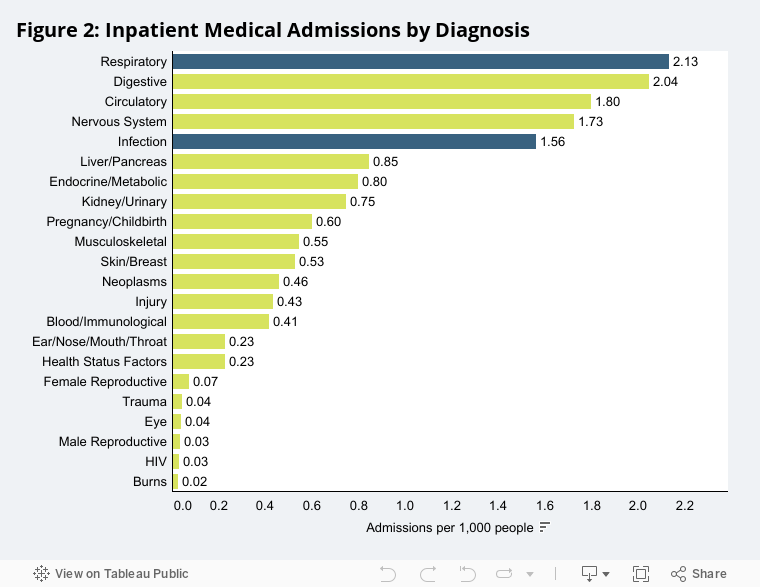
Overall, admissions to the hospital involving medical services accounted for less than a third of all admissions. Medical admissions for respiratory and infection diagnoses were each less than 5 percent of all admissions. We classify the primary diagnosis for each inpatient admission by major diagnostic categories (MDCs). Of medical admissions, respiratory diagnoses (including respiratory infection, pneumonia, and ventilator support) were the most common reason for admission, with more than 2 admissions per 1,000 people in 2018. Digestive, circulatory, nervous system, and infection (including viral illness) round out the top 5 primary medical diagnoses. Infection diagnoses were between 1 and 2 per 1,000 people. Figure 2 shows the number of medical admissions per 1,000 people by MDC.
Length of Stay
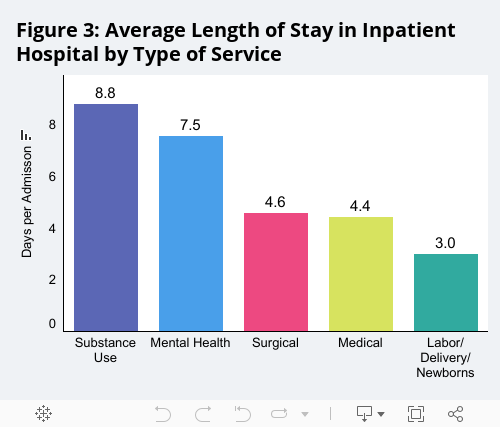
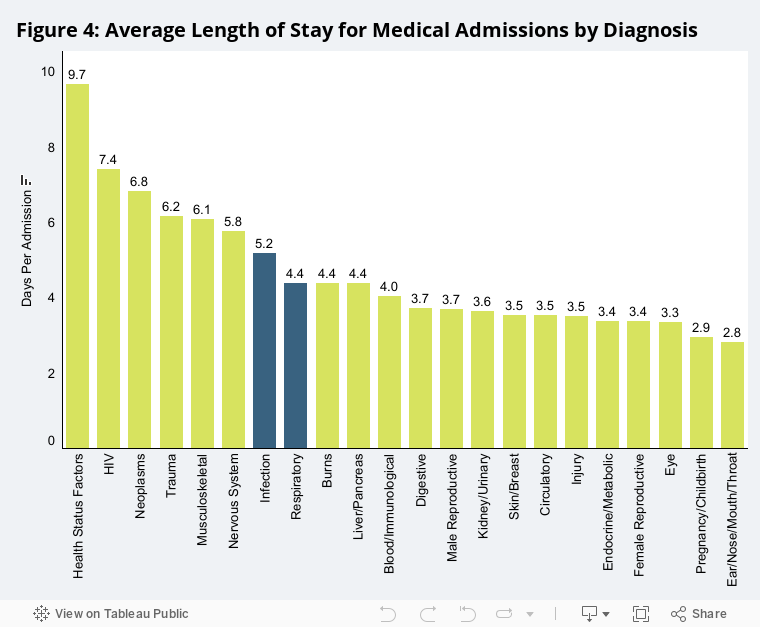
Hospitals will be affected not only by changes in why people are admitted but also in how long they stay. It may be that COVID-19 admissions are different/longer than other types of respiratory or infection admissions. Across types of services, the average number of days a person stays in the hospital ranged from 3.0 for labor/delivery/newborn admissions to 8.8 for substance use admissions in 2018 (Figure 3). In that same year, a respiratory medical diagnosis was associated with a length of stay just above 4 days (Figure 4) and an admission with an infection diagnosis lasted approximately 5 days (Figure 4). These lengths of stay were in the middle of the distribution of lengths of stay for medical admissions. That is, a hospital stay for a respiratory diagnosis lasted about half as long as a HIV or health status factors admission but almost twice as long as a hospital stay for a ear, nose, throat diagnosis. Similarly, the length of stay for an infection-related diagnosis was 30% shorter than one for HIV and almost twice as long as an ear, nose, throat admission.
Average Price of Admission
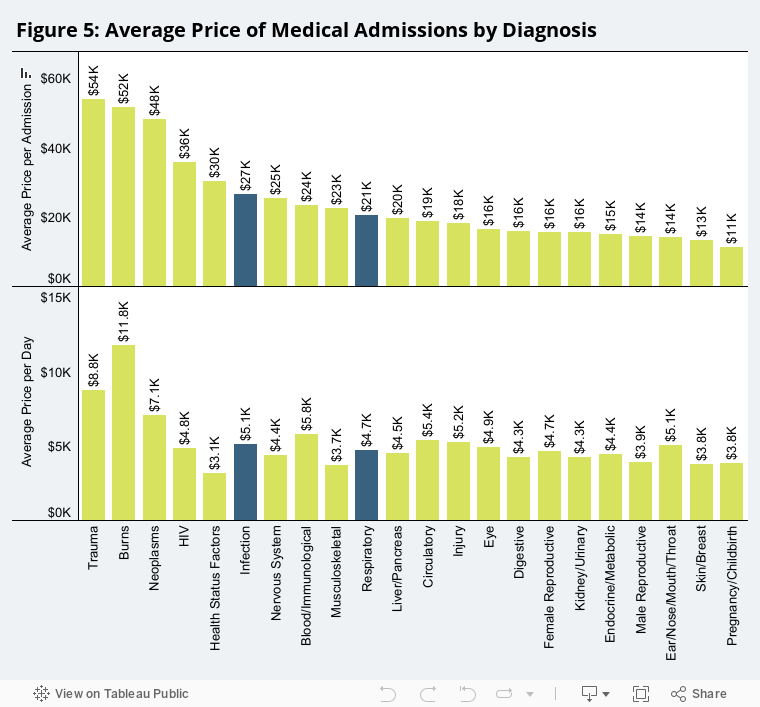
Insurance companies and hospitals typically negotiate payments for admissions based on the diagnosis, type of services provided, and severity of the condition. The average price a hospital receives for admissions of different types provides some (albeit imperfect) information about the relative resources the treatment and care require. In 2018, the average price of a hospital admission (weighted by utilization) was a little more than $22,000 overall. Among medical interventions, in 2018, trauma and burns were the diagnoses with the highest average price per admission, both a little more than $50,000; those related to pregnancy/childbirth had the lowest price at approximately $11,000. Respiratory and infection diagnoses were, again, in the middle. A respiratory diagnosis had an average price per admission of almost $21,000, and an infection diagnosis had an average price per admission of about $27,000. (Note, these prices reflect the amounts paid to inpatient facilities and do not include separate payments to physicians and other clinical staff delivering services during the inpatient visit if those providers bill separate from the hospital. Further, they include both the amounts the insurance company pays and any out-of-pocket liability for which the patient is responsible.) See Figure 5.
To account for differences in length of stay, and more directly compare resources associated with medical services provided on a daily basis, our analysis also looks at average price per day. We observe a three-fold difference in average price per day by diagnosis with the price per day for a burn admission averaging nearly $12,000, and a musculoskeletal admission averaging just under $4,000 per day. For respiratory admissions, the average price per day in 2018 was about $4,700; infection admissions averaged about $5,100 per day in 2018. See Figure 5.
Conclusion
HCCI’s unique dataset can illustrate how a variety of health care services and providers are used. Because it offers perspective on people with employer-sponsored insurance, which covers nearly half of the people living in the US, it provides a valuable benchmark of health care utilization and price. This analysis relies on a subset of the 2.5 billion claims on which the annual Health Care Cost and Utilization Report is based and highlights how hospital resources are distributed across interventions and diagnoses.