
All HCCI Reports
HCCI’s original reports powered by #HCCIdata
-
Examining the adoption of a new Medicare billing code for cognitive assessments: a slow but steady uptake
 Read more: Examining the adoption of a new Medicare billing code for cognitive assessments: a slow but steady uptake
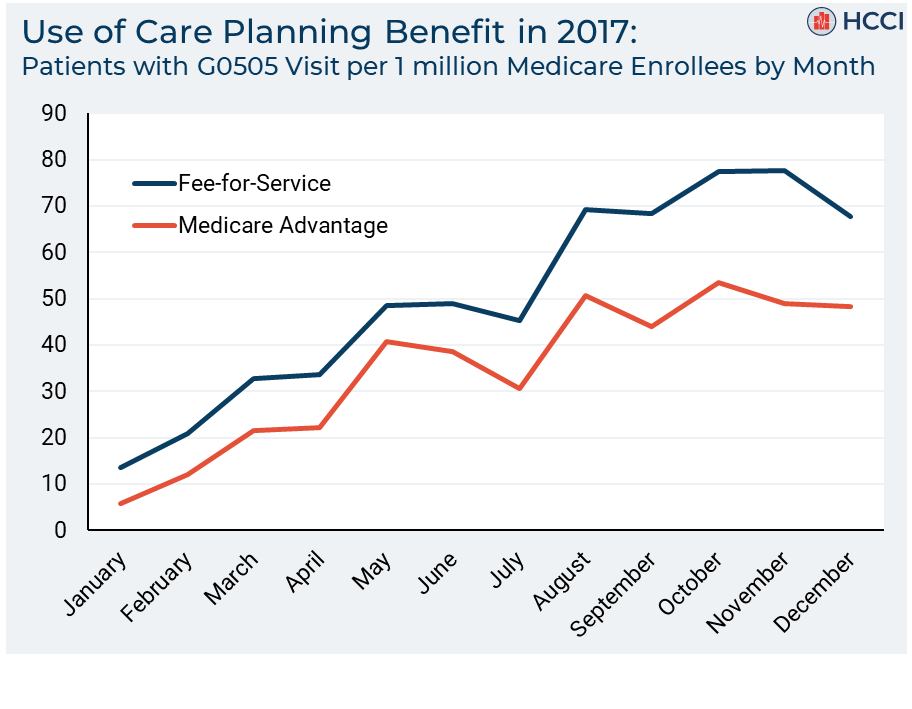
On January 1, 2017, the Medicare program started reimbursing providers for a new procedure code for clinical visits for cognitive assessments and care planning services (CPT code G0505). This newly-billable service is intended to improve the care of patients with Alzheimer’s disease and related dementias and hopefully increase early detection and diagnosis. A G0505 visit…
-
Lower Health Care Spending and Use for People with Chronic Conditions in Consumer-Directed Health Plans
 Read more: Lower Health Care Spending and Use for People with Chronic Conditions in Consumer-Directed Health Plans
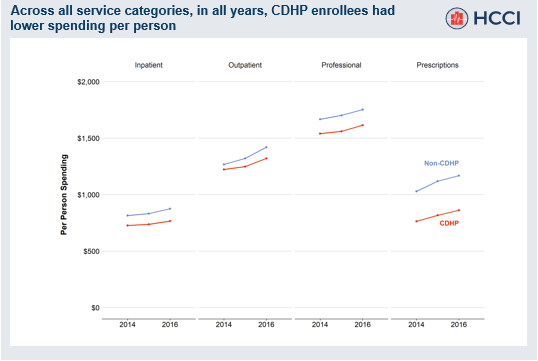
To better understand differences in spending and use across types of health plans, we examine individuals enrolled in consumer-directed health plans (CDHPs) and individuals enrolled in non-CDHP health plans. CDHPs are a type of HDHP that typically include a health savings account (HSA) or a health reimbursement arrangement (HRA). We analyzed a sample of over…
-
Past the Price Index: Exploring Actual Prices Paid for Specific Services by Metro Area
 Read more: Past the Price Index: Exploring Actual Prices Paid for Specific Services by Metro Area
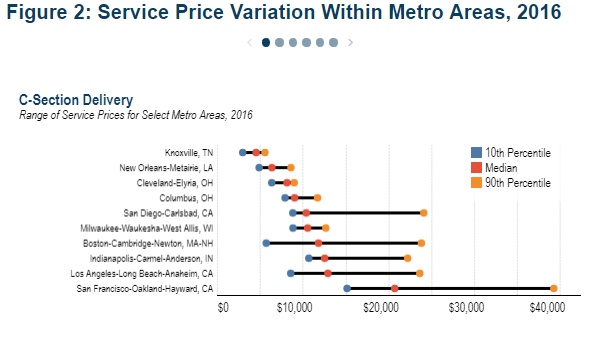
As policymakers, employers, and patients increasingly struggle with rising health care costs, there is a lack of clarity around the actual price of health care services and why those prices are so different. Recent efforts have focused on greater price transparency as a way to impact growing prices. A range of proposals from both Congress…
-
Shifting Care from Office to Outpatient Settings: Services are Increasingly Performed in Outpatient Settings with Higher Prices
 Read more: Shifting Care from Office to Outpatient Settings: Services are Increasingly Performed in Outpatient Settings with Higher Prices
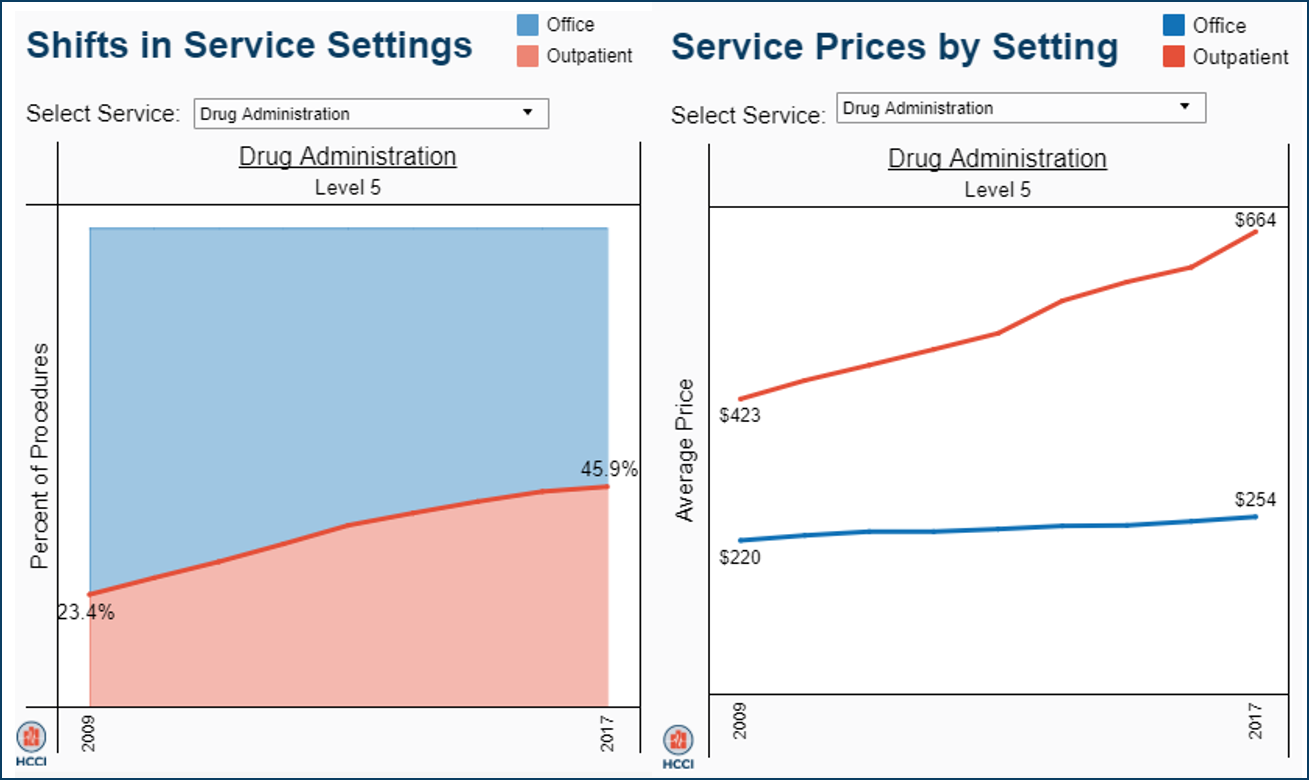
Where people receive health care matters, especially in terms of costs. The same services may have a much higher price tag when performed in one setting rather than another, but this price difference is rarely publicized to patients. To understand what settings people used and how prices differed, we looked at the utilization and average…
-
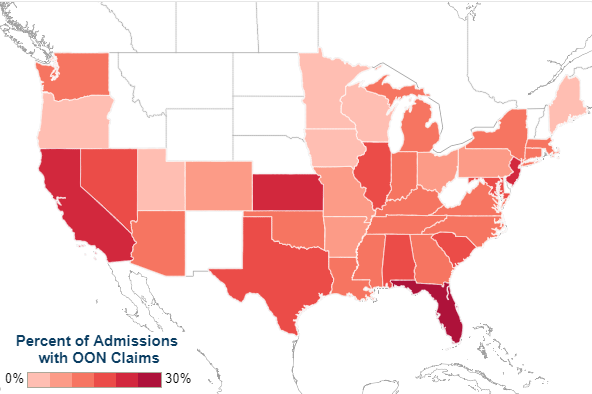
Surprise out-of-network medical bills during in-network hospital admissions varied by state and medical specialty, 2016
 Read more: Surprise out-of-network medical bills during in-network hospital admissions varied by state and medical specialty, 2016
Out-of-network billing practices have increasingly garnered attention as individuals with commercial health insurance continue to experience “surprise billing.” A surprise medical bill commonly describes a charge to a patient for care delivered by an out-of-network (OON) professional who works within an in-network facility. We used the Health Care Cost Institute’s (HCCI) vast commercial claims database to…
-
2017 Health Care Cost and Utilization Report
Tags: Drug Spending, HCCUR, Inpatient Spending, Out-of-Pocket, Outpatient Spending, Physician Spending, Prices, Utilization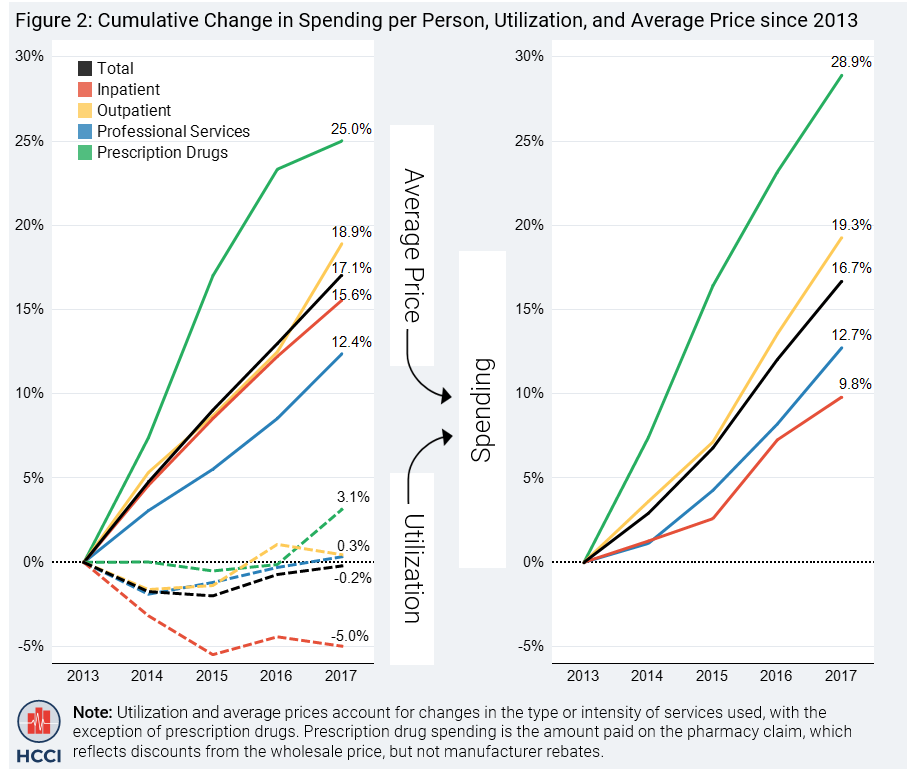 Read more: 2017 Health Care Cost and Utilization Report
The 2017 Health Care Cost and Utilization Report shows that spending per privately insured person grew by 4.2 percent, the second year in a row of spending growth over four percent. Price increases were the primary driver. The report covers the period 2013 through 2017 and includes claims data from four national insurance companies: Aetna, Humana, Kaiser Permanente, and…
-
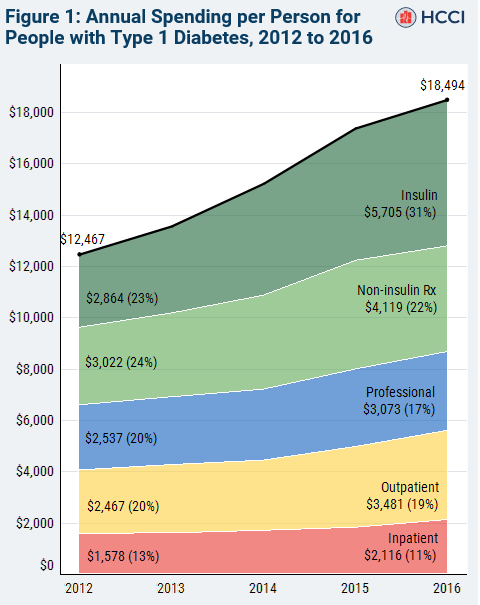
Spending on Individuals with Type 1 Diabetes and the Role of Rapidly Increasing Insulin Prices
 Read more: Spending on Individuals with Type 1 Diabetes and the Role of Rapidly Increasing Insulin Prices
We used health care claims data to investigate trends in total health care spending on individuals with type 1 diabetes between 2012 and 2016. We found a rapid increase in total health care spending, driven primarily by gross spending on insulin that doubled over the period. During that time insulin use rose only modestly. While…
-
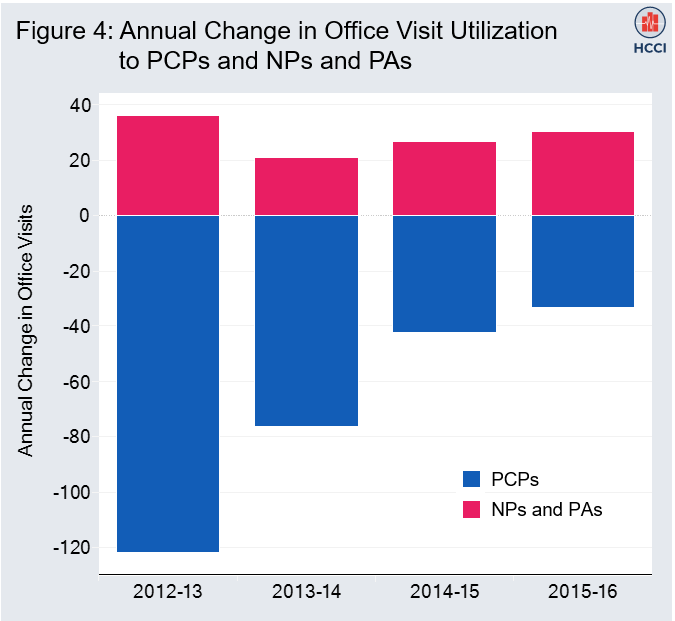
Trends In Primary Care Visits
 Read more: Trends In Primary Care Visits
Office visits to primary care physicians (PCPs) declined 18 percent from 2012 to 2016 for adults under 65 years old with employer-sponsored health insurance, while office visits to nurse practitioners (NPs) and physician assistants (PAs) increased 129 percent. Comparing 2012 to 2016, there were 273 fewer office visits per 1,000 insured individuals to primary care…
-
Understanding how price growth affected areas differently across the country
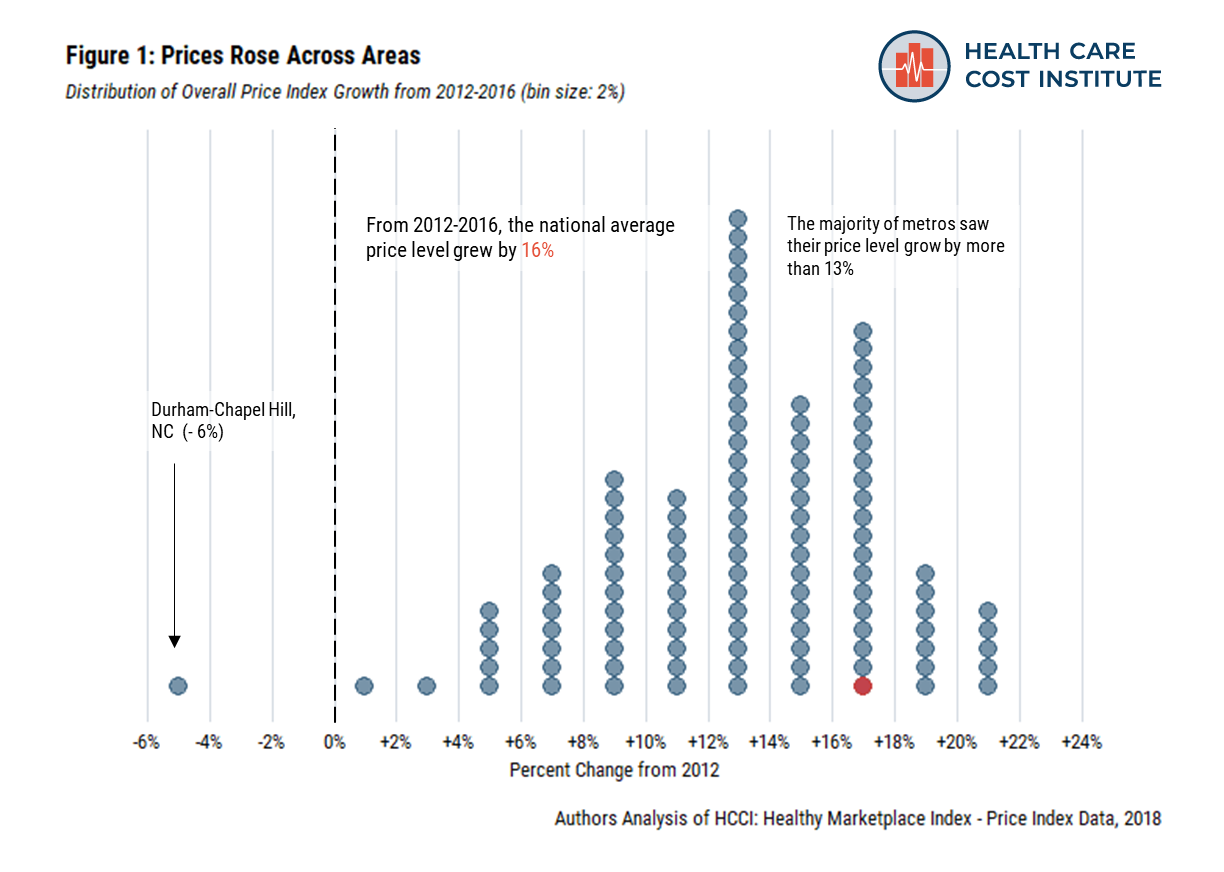 Read more: Understanding how price growth affected areas differently across the country
Recently, the Health Care Cost Institute (HCCI) published its Healthy Marketplace Index (HMI) – Price Index report, examining relative health care prices in 112 different metropolitan areas. This report is the first in a new series of releases from the HMI project, funded by the Robert Wood Johnson Foundation, which compares commercial health care markets…
-
Health Affairs: Health Care Spending Under Employer-Sponsored Insurance: A 10-Year Retrospective
Tags: Commercially Insured, Drug Spending, Health Affairs, Inpatient Spending, Outpatient Spending, Peer Reviewed Journals, Physician Spending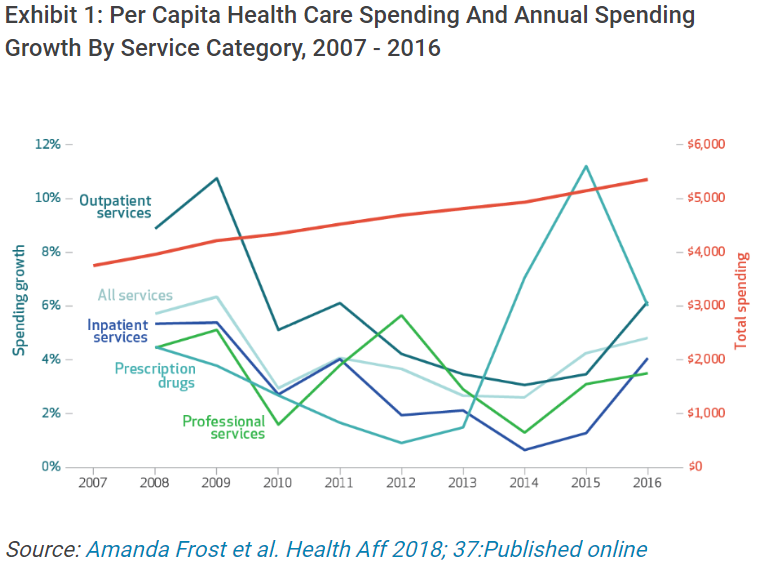 Read more: Health Affairs: Health Care Spending Under Employer-Sponsored Insurance: A 10-Year Retrospective
ABSTRACT Using a national sample of health care claims data from the Health Care Cost Institute, we found that total spending per capita (not including premiums) on health services for enrollees in employer-sponsored insurance plans increased by 44 percent from 2007 through 2016 (average annual growth of 4.1 percent). Spending increased across all major categories…