
Total spending on drugs includes spending on prescription drugs (typically oral medications prescribed by a physician, picked up by a patient at a local pharmacy, and taken at home) and administered drugs (typically injected or infused under the supervision of a health care professional either in an outpatient facility or physician office).
In HCCI’s Health Care Cost and Utilization Report, we report spending separately on prescription drugs and administered drugs among individuals with employer-sponsored health insurance (ESI). In this HCCUR Data Point, we use the publicly available data from the 2020 HCCUR to examine spending, price, and use trends in total drug utilization (administered and prescription) between 2016 and 2020. Spending, price, and use are measured here following the methods described in the main HCCUR report.
Total ESI Spending on Administered and Prescription Drugs was $1,756 per Person in 2020; 27% of this Spending was on Administered Drugs
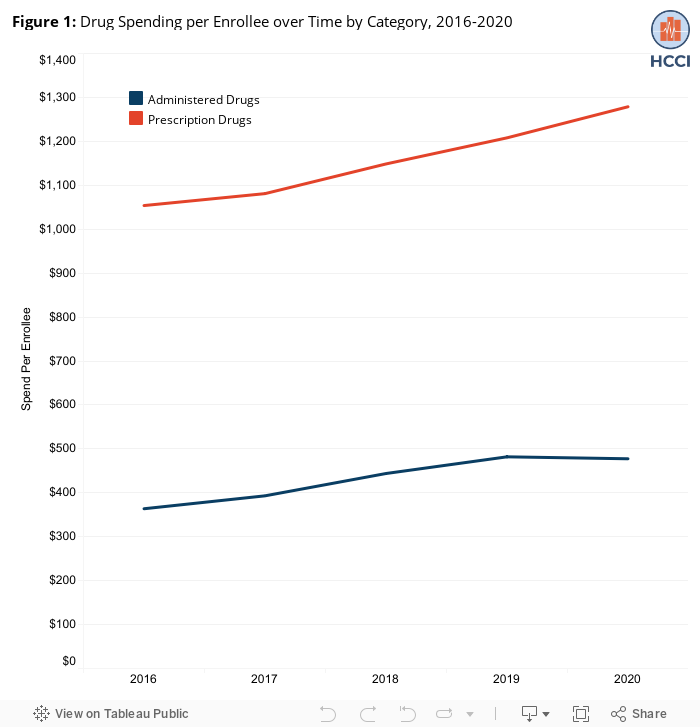
In 2020, per person spending on all drugs among individuals with ESI was $1,756. Of this total, $477 (27%) was on administered drugs and $1,279 (73%) was on prescription drugs (Figure 1). Thus, total drug spending (including administered and prescription drugs) was 31% of total per person spending in 2020 across all service categories ($5,607, as reported in the 2020 HCCUR). Fees associated with administration of drugs accounted for an average of 11% of total administered drug spending.
ESI Spending on Administered Drugs Grew Faster than Spending on Prescription Drugs over 2016-2020
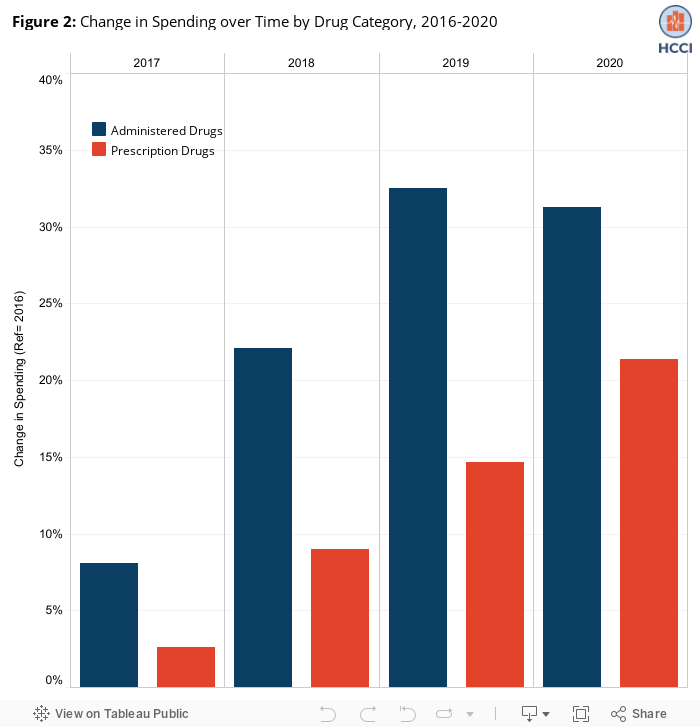
While prescription drugs made up a greater percentage of total drug spending, administered drug spending grew significantly faster than prescription drug spending over the 2016-2020 period (Figure 2).
Per-person spending on administered drugs increased 31% from 2016 to 2020 (from $364 in 2016 to $477 in 2020) (Figure 2). Prescription drug spending also increased during this time but at a lower rate, 21%, from $1,054 to $1,279. In 2020, those trends shifted with administered drug spending declining (consistent with the decrease in medical service use during the first year of the COVID-19 pandemic) and prescription drug spending rising.
Administered Drug Prices Increased Faster than Prescription Drug Prices over 2016-2020
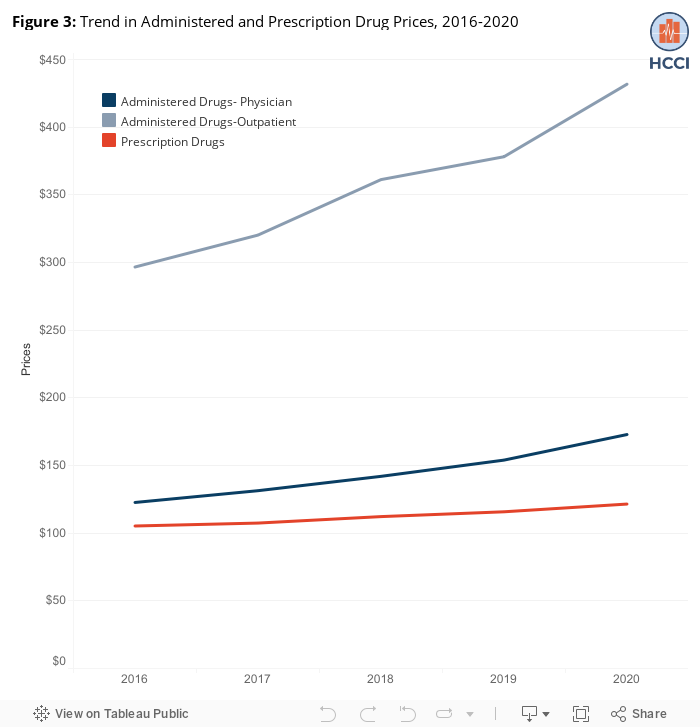
The growth in spending in administered and prescription drugs may be explained by rising use, rising prices, or a combination of the two factors. While the use of both types of drugs remained relatively unchanged over this period (see Downloadable Data), prices for both categories rose.
We examined prices over time by dividing total spending on each category of drugs by total use (e.g., claims in the case of administered drugs). We found that prices for prescription drugs increased modestly, from $105 in 2016 to $122 in 2020, a 15% increase. In contrast, prices for drugs administered in an outpatient setting increased by 46%, from $297 in 2016 to $432 in 2020. Consistent with earlier work, prices for drugs administered in professional settings were lower than drugs administered in outpatient settings in each year, but still rose at similar rates. Prices of drugs administered in professional settings rose from $123 in 2016 to $173 in 2020, a 41% increase (Figure 3).
HCCI Data Supports Policy Efforts to Monitor Drug Spending in ESI Population
Combining data on prescription and administered drugs, we found that total per person spending on drugs among ESI enrollees was $1,756, or 31% of total per person spending as reported in HCCUR. Just over 70% of this spending was on prescription drugs, with the remainder spent on administered drugs. Even though administered drugs represent a smaller proportion of total drug spending, spending on these drugs has risen considerably faster than spending on prescription drugs, driven by rising prices. Our calculations based on these per-person estimates suggest that total ESI spending on drugs increased from $252 billion in 2016 to $312 billion in 2020 (24% growth).
HCCI’s public HCCUR data allows policymakers, advocates, researchers, and other users to monitor spending on and use and prices of both prescription and administered drugs. Further, these data allow for more comprehensive tracking of trends between these two discrete drug categories. Drug prices have been the target of most policy efforts to lower prices to date (e.g., direct government negotiation of prices). While these efforts have largely focused on prescription drugs, there is increasing recognition of the need to address high prices for administered drugs, especially as biosimilars become more widely available. Comprehensive and longitudinal data on prices, spend, and use for all drug utilization among the ESI population will be crucial in these ongoing policy efforts.