
Introduction
As rising health care costs force difficult choices for families, employers, and federal, state, and local governments, a range of policy proposals are emerging to address health care spending in the U.S. In this presidential election year, there has been heightened attention on lowering health care costs and making care more affordable, which will likely accelerate with the election of President Biden. Several Members of Congress and nearly every Democratic presidential primary candidate supported substantial health care reforms ranging from “Medicare for All” to a public option.
Several states also have considered legislation to lower health care costs. Washington State, for example, enacted Cascade Care, which will offer a state-sponsored plan on their individual market exchange that will cap payments for all providers and facilities at a percentage of Medicare rates. New Mexico considered a Medicaid buy-in, which would have leveraged Medicaid reimbursement rates, and Colorado’s proposed state public option included a base reimbursement rate for hospitals tied to Medicare. A common way in which these policy proposals aim to lower health care costs is by linking the payments made by private health insurers (which are typically higher than public payers) to what Medicare and Medicaid (or public payers) would pay for similar services.
Recently, HCCI published an analysis comparing the payments made by private insurers to physicians and other clinicians for professional services to Medicare rates for the same services. Our analysis was limited to studying the prices paid for individuals with private insurance through their employers. Professional services are the most common health care service among individuals with insurance through their employer. In 2018, people with commercial insurance received an average of 17 professional services. By comparison, the average individual did not have an inpatient admission and had just two outpatient visits or procedures. Altogether, professional services accounted for 30% of health care spending.
We found that commercial insurance companies paid 122% of Medicare rates, on average, for professional services across the country, much more similar to Medicare rates than other types of services. For example, previous estimates of inpatient service prices range from 151% to 222% of Medicare rates and outpatient prices range from 161% to 358%.While professional services tend to be reimbursed at rates more similar to Medicare, there still are significant differences across metro areas from 231% of Medicare in LaCrosse, WI to 98% of Medicare in Chambersburg, PA..
In this blog, we consider how a set of hypothetical policies that link commercial insurance payments to Medicare rates would impact prices paid by commercial insurers for professional services in 2017. Specifically, we consider the impact of three types of hypothetical policies:
- Rate Cap: Constraining commercial prices such that they cannot exceed a particular percentage of Medicare rates.
- Combined rate cap and rate floor (“cap-and-floor”): Establishing an allowable range of commercial prices that cannot be lower or higher than specified percentages of Medicare rates, and
- Benchmarking Commercial Rates (“rate setting”): Requiring commercial rates to be equal to a benchmark tied to Medicare rates or some percentage thereof.
For all of these hypothetical policies, we find that the impacts on prices will vary dramatically across and within states, largely because of the distribution of commercial prices relative to Medicare across the country. The impact of each policy also depends heavily on where benchmarks are set. Importantly, this analysis is focused solely on professional services so does not address the impacts of policies that would, for example, tie hospital inpatient or outpatient reimbursement to Medicare rates.
This analysis is intended to illustrate how the variation in average commercial professional service prices relative to Medicare across metro areas could result in differential policy impacts across the country. This analysis is not intended to forecast or estimate the impact these policies would have on health care spending, utilization, or prices if they were implemented.
Rate Cap
Under this policy, commercial payments to health care providers would be capped at a multiple of Medicare rates. Payment rates could be lower than the established cap but could not exceed it. In Washington State’s Cascade Care, for example, reimbursement by private health plans on their individual market state Exchange cannot exceed 160% of what Medicare would have reimbursed providers for similar services. For context, based on data from their all-payer claims database, Washington State officials estimate that their Exchange plans previously paid an average of 174% of Medicare.
To illustrate how a rate cap could potentially impact the prices paid to professional service providers, we looked at the average impact of a hypothetical policy limiting commercial prices to below 160% of Medicare rates in different metro areas around the country. While the rate cap in Washington applied only to plans offered on the state exchange, for the purposes of our analysis we assumed this cap would be unilaterally applied retrospectively to all commercial insurers uniformly across the country.
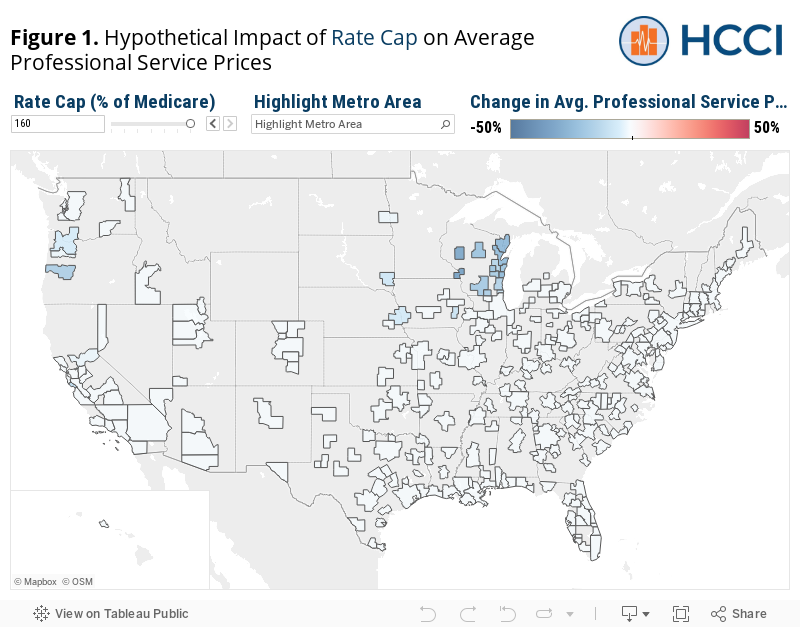
By its nature, the primary impact of a rate cap is lowering prices in areas where they are above the cap (i.e., the relatively highest commercial priced metro areas). The extent to which a rate cap could have directly impacted prices in 2017, however, varies dramatically by the level at which the cap would have been set. The average commercial price paid for professional services was above 160% of Medicare in just 8% of metro areas in our sample (23 out of 271 metro areas). Therefore, a cap at 160% of Medicare would have had a somewhat limited impact as it would affect only the small number of metro areas where prices tend to be far above Medicare rates. In fact, collectively across all sample metro areas, the median metro area would have seen no change in prices.
The impact in any given metro area could be quite different had the rate cap been set at a different threshold. Using the dashboard below, you can see which metro areas would have been impacted by a hypothetical rate cap set at different multiples of Medicare rates and the average impact on the commercial prices paid for professional services in those areas. For example, a cap set at 100% of Medicare would have had a much broader impact – affecting 91% of metro areas in our sample (247 metro areas).
The geographic areas affected by a rate cap (how many and which ones) would vary dramatically based on the threshold at which the cap was set. A cap set at 160% of Medicare, for example, may have had a limited geographic impact because the areas with the highest commercial professional service prices relative to Medicare rates were primarily clustered in the upper Midwest and pacific Northwest. By contrast, a cap set at 100% of Medicare would have impact metro areas in every state included in our sample.
The degree to which a policy impacts prices in those areas affected also would vary depending on the level at which a cap would be set. A higher cap would have led to smaller decreases in average prices while a lower cap would have a large effect on average price. Of the 23 metros affected by a 160% of Medicare cap in our analysis, the median metro area’s prices would fall 12%. By comparison, among the 247 metros affected by a 100% of Medicare cap, the median decrease in commercial professional prices would have been 20%.
Rate Cap Combined with a Rate Floor (“Cap-and-Floor”)
Policymakers could pair the rate cap described above with a rate floor, effectively setting a range within which reimbursement would fall. For example, in Washington State’s Cascade Care, the reimbursement cap of 160% of Medicare is paired with a provision that primary care physicians must be reimbursed at least 135% of Medicare.
To demonstrate how this construct would work if applied more generally, we looked at the average impact of a hypothetical policy limiting prices to below 160% of Medicare rates and above 120% of Medicare rates on professional service prices for all types of providers. For prices that fell outside of the thresholds, as before, we reassigned average prices in those areas to be at the thresholds. In places where prices were between 120% and 160% of Medicare, though, we allowed prices to remain the same.
The rate cap portion of this policy has the same impact, decreasing average commercial prices in the 8% of metro areas where commercial prices were above 160% of Medicare rates. The addition of a rate floor, however, would cause upward pressure on prices in areas where prices tended to be below the price floor. In this example, a rate floor of 120% of Medicare would have increased average prices in 57% of metro areas (154 metros) where commercial prices were lower than the rate floor, on average. The remaining 35% of metro areas studied had commercial prices between the 120% to 160% range and, therefore, would not have been impacted. Collectively, across all sample metro areas, the median metro would have experienced a 2% increase in commercial professional prices under this hypothetical policy (compared to no change in prices in the median metro area under a 160% of Medicare rate cap alone).
Even more than a rate cap alone, the cap-and-floor policy would result in different impacts on commercial service prices among metro areas on different ends of the price distribution. The areas in which average commercial professional service prices were above the cap (160% of Medicare) were clustered in the Pacific Northwest and Upper Midwest. As a result, these areas are where a cap-and-floor policy would result in decreased prices. By contrast, areas where prices tended to be below the floor (120% of Medicare) were clustered in the Southeast and Mid Atlantic. These areas are where a cap-and-floor policy would likely result in increased prices.
This geographic variation in the positive and negative impacts of the cap-and-floor policy is found not only across the country, but, in some cases, within states. For example, in both California and Texas, some metro areas would have seen average prices decrease while in others average prices would have increased due to the price cap and floor, respectively.
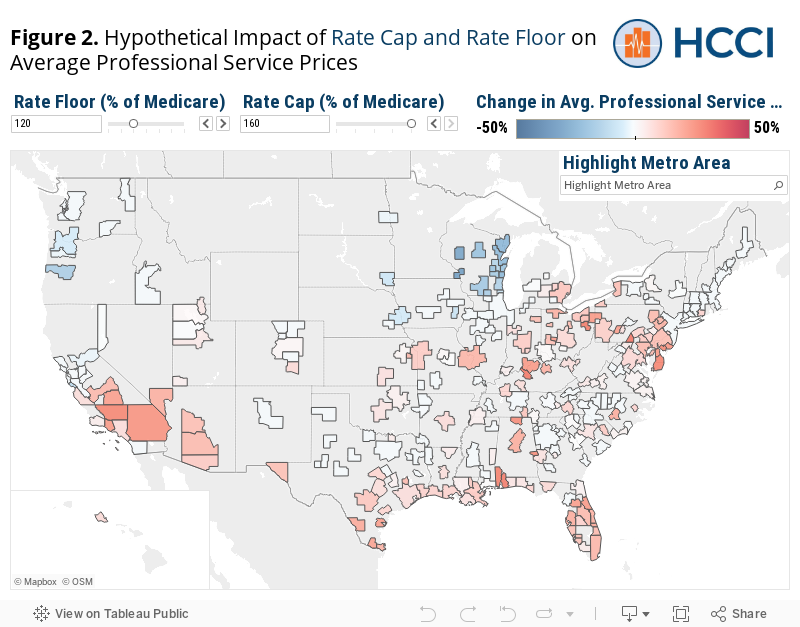
As with the price cap implemented alone, the impact of these policies would vary substantially depending on where the floor and cap thresholds are set. For example, a policy which sets a price floor at 100% of Medicare and a cap at 120% of Medicare would have resulted in average professional service prices decreasing in 45% of metro areas, prices increasing in only 8% of metro areas, and no substantial impact on prices in about 48% of metro areas.
Our analysis suggests professional service prices in the majority of metro areas were between 100% and 130% of Medicare in 2017. Therefore, policies with caps and floors set within that range will have a larger impact in both directions than beyond those endpoints. At price floors increasingly above 100% of Medicare, more metros would experience an increase in prices. Conversely, at price caps increasingly below 130% of Medicare, more metros would experience a decrease in prices. To see the differential impact, use the toggles in the dashboard above (Figure 2) to change where the rate floor and ceiling are set.
Benchmarking Commercial Rates (“Rate Setting”)
Lastly, we consider how a policy that sets commercial rates at a fixed percentage of Medicare would affect existing commercial professional service prices in 2017. Several congressional Medicare for All proposals, for instance, set private insurance payments at Medicare rates. Some of these proposals include benchmarking to Medicare rates only in the near term; some would rely on them as a fallback if negotiations with private insurers were unsuccessful.Other policy proposals would pay private insurance companies a multiple (e.g., 120% or 225%) of Medicare rates for certain services. For example, the Colorado Health Insurance Option base rate for hospitals would be 155% of Medicare reimbursement, though hospitals’ individual reimbursement rates would vary.
To see the impact of rate setting, we look at the impact of a hypothetical policy that sets all commercial professional prices to 140% of Medicare rates, regardless of whether the original commercial price is above or below that threshold.
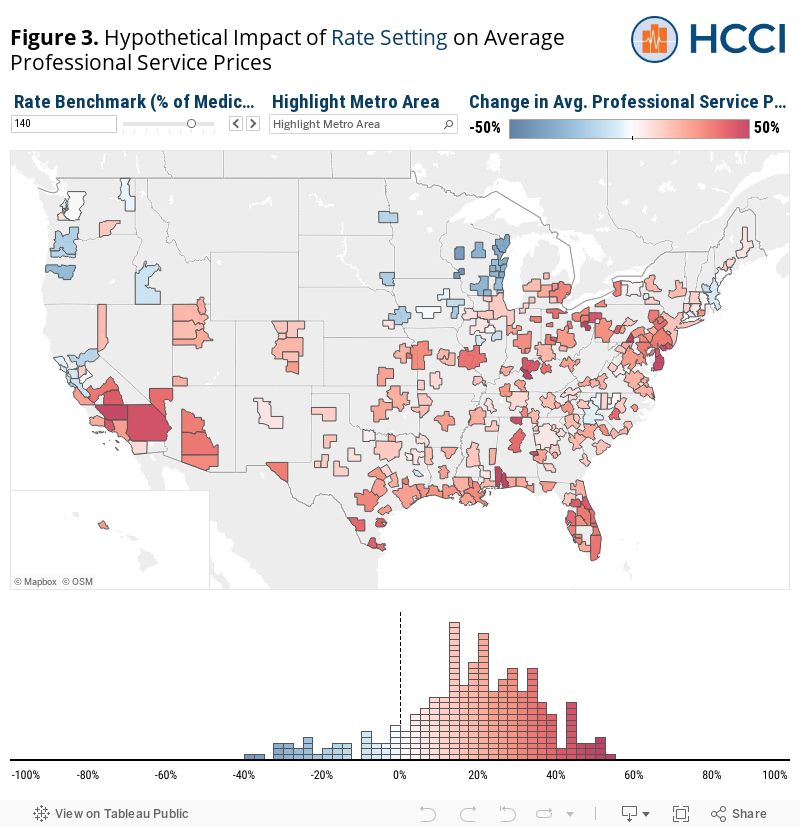
Because commercial prices would be set at one specific point, there are no areas where prices would remain exactly the same (except for those with prices exactly equal to the Medicare benchmark). Policies setting a commercial rate effectively set a rate cap and rate floor; the cap and floor are just equal to each other. Thus, the impacts of rate setting and cap-and-floor policies are similar. Namely, these policies would result in a mix of prices increasing in some places and decreasing in others. The main difference between the policies’ impact is that prices in more metros are affected (and to a larger extent) under rate setting compared to a cap-and-floor policy.
The magnitude of the price changes also would be larger under a rate setting policy than under a cap-and-floor policy. For example, setting commercial rates at 140% of Medicare would have led to a change in average commercial prices in nearly all metro areas in our study unless they happen to have an average commercial price equivalent to that rate. Under the cap-and-floor policy, in contrast, “only” 65% of metros would have experienced a change in average prices.
The type of impact these policies would have on metro areas would be similar, but the magnitude of any changes would likely be larger. Areas which would see price increases (decreases) under a cap-and-floor proposal would see larger price increase (decrease) under rate setting. For example, areas in the Pacific Northwest would likely see prices decrease and areas in the Mid Atlantic would likely see prices increase under both policies – the degree to which prices increase and decreases in these areas could be dramatically different with rate setting than under cap-and-floor. Under our hypothetical 140% of Medicare rate setting policy, the median increase in prices – in the 231 (out of 271) areas where prices increased – would have been 21% (compared to 9% median increase among 153 metros with the 160% cap and 120% floor policy). The median decrease in prices – in the 40 areas where prices decreased – would have been 15% (compared to a 13% median decrease among 23 metros under the 160% cap and 120% floor).
As with all the policies discussed, the impact of a rate setting policy would vary considerably depending on the level at which it is set. To see more examples of hypothetical rate setting policies, use the toggles in the dashboard above to see how different rates would result in different price changes in metro areas around the country.
Conclusions
We outlined the impact on professional service prices of three policy proposals that aim to control prices in the employer sponsored insurance market, all of which set rates based on Medicare’s Physician Fee Schedule. Our work motivates the following insights about how each of these proposals may qualitatively impact commercial professional service prices based on the distribution of prices in metro areas around the country:
- A rate cap generally would bring down prices but given that the national commercial rate averaged around 122% of the rates listed by the Medicare Physician Fee Schedule, without setting rates closer to 100% of Medicare, only a limited number of localities would see lower professional service prices. It is important to note, too, that our analysis did not account for the possibility that providers with lower rates might raise their prices to meet the cap.
- A cap-and-floor policy would potentially increase prices in the limited number of localities where commercial prices were, on average, lower than Medicare. The number of localities affected, however, would largely depend on where the rate floor is set. Only 8% of metros areas would see average price increases at a floor of 100% Medicare; floors above 100% of Medicare will likely have a larger impact in a greater number of places.
- Finally, rate setting would impact nearly every locality and have the most varied impact, nationally and even within many states.
In all cases, the impact of the above policies would vary dramatically across and within regions and greatly depend on where benchmarks are set. Given that most metro area professional prices are clustered between 100% and 130% of Medicare’s Physician Fee Schedule, policies tying commercial prices to Medicare rates would have the greatest overall impact on average costs if set in this range. Understanding the true effect of these policies requiring looking at how the impact would vary across the country – how many and which metro areas would be affected and by how much.
This analysis’ findings show the importance of awareness of existing dynamics of commercial prices when designing policies that would set prices based on a Medicare benchmark. This work also serves to highlight where regional objection to a national or even state policy linking commercial and Medicare prices could come from. Finally, these analyses that examine variation in prices require detailed data resources. While state-level APCDs may provide insight into commercial rate setting for the few states that have them, more robust national data resources would facilitate better decision-making about these kinds of complex policy proposals.
Methods and Limitations
Our analysis is limited to measuring the impact of hypothetical policies using aggregate measures of average commercial and Medicare professional service prices at the metro area level. While these measures are based on standardized market baskets of services to the extent that different services within the market baskets would be differentially impacted by the hypothetical policies depending on how heavily those services were weighted, the true impact of those policies on the average prices we would have measured may differ from what we report here. However, the purpose of this blog is to illustrate how the same policy may result in differential impacts on commercial prices depending on how commercial prices compare to Medicare in different areas – not to estimate or forecast the precise impact of the hypothetical policies.
In this blog, we used the results of our previous analysis to look at the impact of a series of hypothetical policies on commercial professional service prices. Specifically, we explore the impact of a rate cap, combined rate floor and rate cap (“cap-and-floor”), and rate benchmark based on Medicare rates. Take, for example, Washington, DC where average professional commercial and Medicare prices were $84 and $76, respectively. If a policy were enacted that tied commercial rates to Medicare, professional prices in Washington, DC would decrease by $8 (10%) on average. This exercise was applied to all metro areas for each hypothetical policy. Of note, some metro area prices would not be affected by some policies (e.g., local commercial prices were already below a proposed rate cap) and are labeled as “not affected” throughout the study.
This analysis also has several limitations that would affect our measure of the impact of any of these policies on health care prices. Notably, this analysis assumes that the hypothetical policies were applied uniformly to all geographies, all commercial payers, all providers, and professional all services. This also implies that we assume that insurance networks would remain static as policies were implemented. Further we do not explore the possibility that providers not directly impacted by the hypothetical policies change their prices in response as well (i.e., low priced providers raise their prices to a price ceiling in addition to the high-priced providers lowering). We also do not explore how prices for other types of services may be impacted or how the prices of some professional services may be changed if these hypothetical policies simultaneously affected, for example, inpatient and outpatient prices.
Our analysis is limited to studying professional services, one of the only payment systems for which Medicare pays on a fee-for-service schedule. While some value-based purchasing models in Medicare or cost control programs in commercial plans may leverage bonuses and shared savings to providers to encourage reducing unnecessary utilization, both still largely follow a fee-for-service model. Periodic regulatory updates to Medicare payment policy have, in the past, invariably yielded practice pattern changes among physicians. Similarly, we would expect that changing the pricing structure for commercial payers as this policy outline lays out, would alter the utilization incentive structure for clinicians in ways we do not attempt to predict. What should be understood, and as this paper suggests, is that commercial price regulation may increase margins for certain providers and certainly decrease margins for other providers. Any potential legislation would undoubtedly need to have additional mechanisms that ensure a stabilized market and protect patient’s access to care.
Importantly, this analysis focuses on 271 metropolitan areas, which represents 69% of the U.S. population. This analysis does not account for the effects of a rate setting policy on commercial prices in more rural areas of the country. Policies would need to consider the potential effects on these areas. Our analysis is also based only on a convenience sample of the prices paid by three large national insurers from the Health Care Cost Institute database.
Finally, our analysis is only meant to contribute relevant data to help inform the ongoing conversations and debate surrounding potential policies proposals tying commercial prices to Medicare rates. Our use of hypothetical policies and our discussion of their potential impacts are meant to serve as examples of issues policymakers should consider ahead of time before policy implementation. These results are not meant to serve as definitive declarations on the impact of such policies and further are not a definitive referendum on provider commercial prices. Many providers have argued that Medicare prices are not an accurate description of how much a service costs in reality.1
1In its 2021 proposed Medicare Physician Fee Schedule, the Centers for Medicare and Medicaid Services (CMS) indicated it would increase the number of work Relative Value Units (wRVUs) for seven of the most highly used CPT codes for evaluation and management (E/M) services. In order to maintain budget neutrality, CMS would reduce the related Medicare conversion factor (which is used to convert a wRVU to a specific dollar amount) by approximately 11%, down to $32.26. Some physician groups, particularly procedural groups, are arguing that CMS and Congress should waive budget neutrality to ensure there is not major payment cuts for physician services in 2021. For more, see the following link: https://www.policymed.com/2020/10/cms-proposed-2021-medicare-physician-fee-schedule-physician-groups-call-for-permanent-changes-to-telehealth-reimbursement-and-other-comments.html