
The COVID-19 pandemic shaped health care spending and use over the past two years in numerous ways. We recently released our Health Care Cost and Utilization Report which provides data from the first year of the pandemic on health care use, spending, and prices across different types of services for approximately 55 million individuals enrolled in employer-sponsored health insurance. In the report, we document trends in health care spending and describe how use and prices of health care services contributed to spending changes between 2016 and 2020.
In this and past reports, we show that per-person spending on health care rose steadily from 2012 through 2019, driven largely by rising prices, but with increases in use as well. In 2020, we observe the first decline in national average spending per person since we started issuing the Health Care Cost and Utilization Report in 2012. As shown in the report, the drop in spending was driven by a dramatic reduction in the use of hospital and physician/clinician services in 2020.
In this post, we use HCCI’s unique commercial claims data to go beyond an annual assessment of health care spending by examining monthly changes in spending and use during 2020 and compared to 2019. We find that the decline in spending in 2020 was concentrated in April and May of that year, with an initial reduction in March. Spending in other months of 2020 was relatively similar to pre-pandemic levels. The decline in April and May was large enough to result in an overall decrease in spending from 2019 to 2020, however spending was still 9% higher in 2020 than in 2016, and about equivalent to 2018 spending.
As expected, spending dropped—driven by a reduction in use—particularly for elective services (e.g., musculoskeletal hospital admissions, imaging) while it rose for services that were associated with the pandemic (e.g., telehealth, respiratory hospital admissions). Prices, which are in large part negotiated and set well in advance of payments being observed in claims, grew at rates similar to 2017–2019. The fact that price growth was consistent and declines in spending were driven by relatively short-lived changes in use suggest that rising health care spending will continue to be a challenge faced by patients, employers, and insurers.
Spending Reductions were Concentrated in April and May of 2020
Our primary measure of health care spending is national, average per-person spending, which captures spending on hospital inpatient admissions, hospital outpatient visits, physician/clinician services, and prescription drugs. When we compared monthly spending in 2020 to the same month in 2019, we found that average total per-person spending in January and February of 2020 was similar to spending in January and February of 2019 (Figure 1).
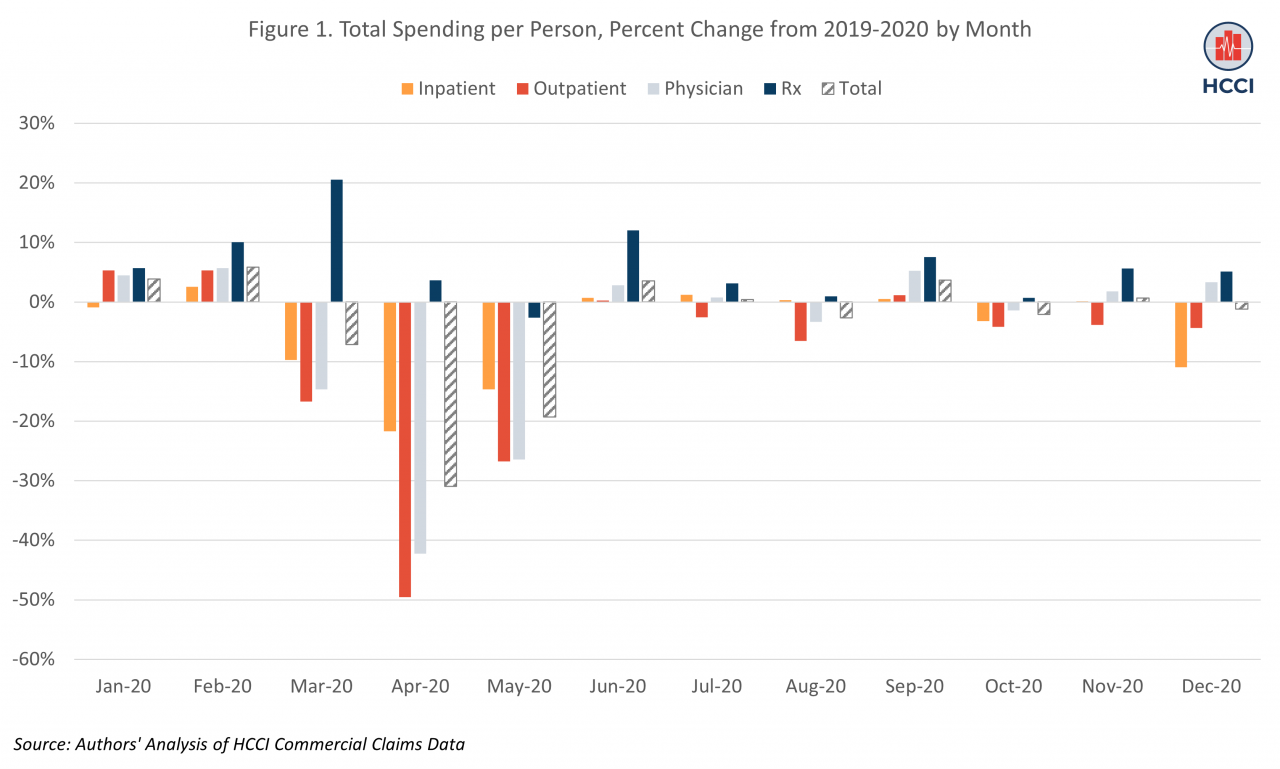
In March 2020, spending started to decline, consistent with the declaration of COVID-19 as a national health emergency and the introduction of stay-at-home requirements in many states. In April 2020, average per-person spending dropped to its lowest point in 2020, 31% lower than in April 2019 ($335, compared to $485 in April of 2019). Spending remained 19% lower in May 2020 relative to May 2019. By June 2020, however, average spending had rebounded to levels comparable to 2019.
The decline in spending was largest for outpatient hospital and physician/clinician services, reflecting the fact that many of these services may have been easier to defer or skip than inpatient care. Average per person spending on hospital outpatient services was close to 50% lower in April 2020 than April 2019 and almost 27% lower in May 2020 than May 2019; again, however, spending per person had largely returned to 2019 levels by June 2020. Physician/clinician spending was 42% lower in April and 26% lower in May of 2020 than the same months in 2019 but comparable to pre-pandemic levels for the rest of 2020.
Spending Declines were Largest for Elective Services while Spending on COVID-related Services Rose
Spending declines were especially large in categories of services where care was more likely to be elective or deferable (though long-term spending and clinical outcomes of this skipped/deferred care remain to be seen). For example, we looked at monthly per person spending on hospital admissions for musculoskeletal, circulatory, childbirth, and respiratory services (Figure 2). These categories of services account for over 40% of inpatient spending in 2020.
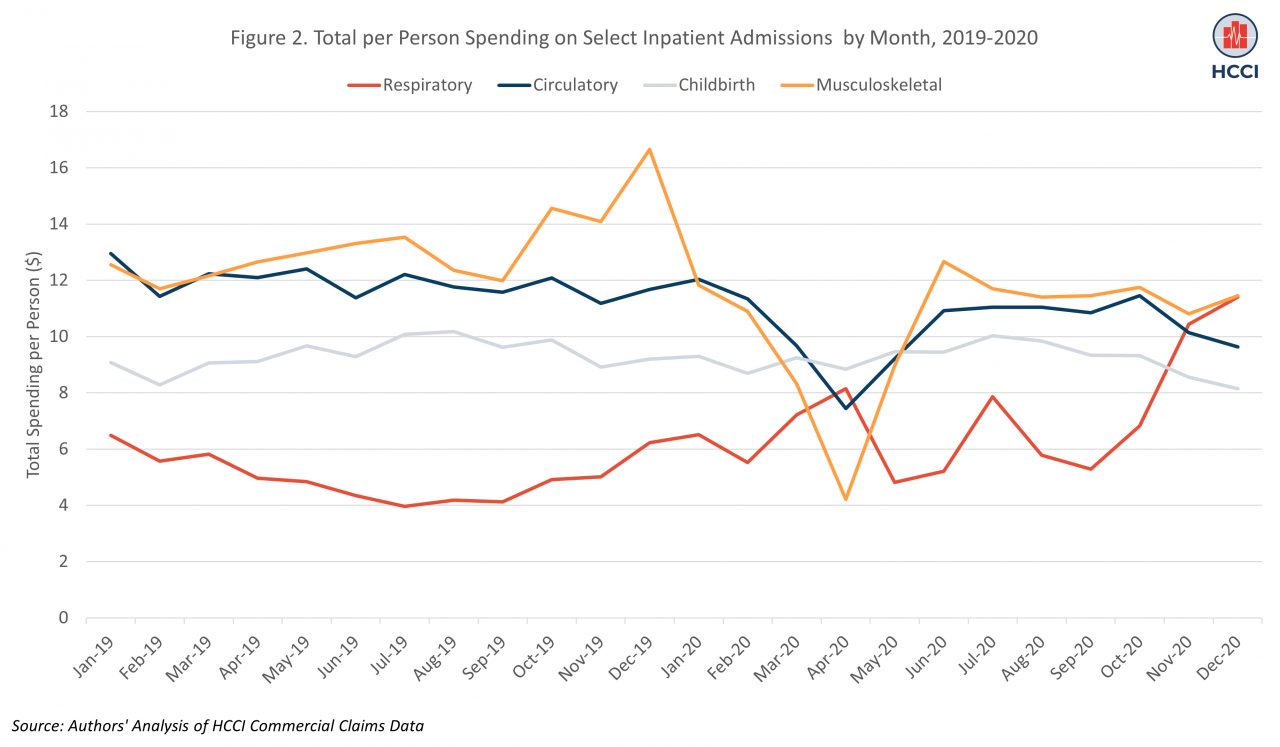
In many ways, childbirth and musculoskeletal services are opposite extremes in the range of non-elective to elective inpatient services. Consistent with this, spending on childbirth was unchanged in 2020 compared to 2019, while spending on musculoskeletal services (e.g., joint replacement) declined dramatically. Spending on musculoskeletal services was 67% lower in April of 2020 compared to April of 2019. Spending on circulatory services, many of which are harder to defer than musculoskeletal care, was 39% lower in April 2020 compared to April 2019. As expected, there was substantially higher spending on respiratory admissions, which includes most hospitalizations related to COVID, in nearly all months of 2020 compared to the same month in 2019. In November of 2020, spending per person on respiratory hospital admissions was over double spending for respiratory admissions in 2019.
Most exceptions to the trend of lower spending in 2020 were for COVID-related services. Here, we examine spending on two of these services: COVID tests and telehealth. The majority of COVID tests are included in the general lab category of non-hospital physician/clinician services. As with other services, spending on clinical labs was substantially lower in March-May of 2020 compared to the same months in 2019; at its lowest, in April of 2020, spending was 46% lower than in April 2019 (Figure 3).
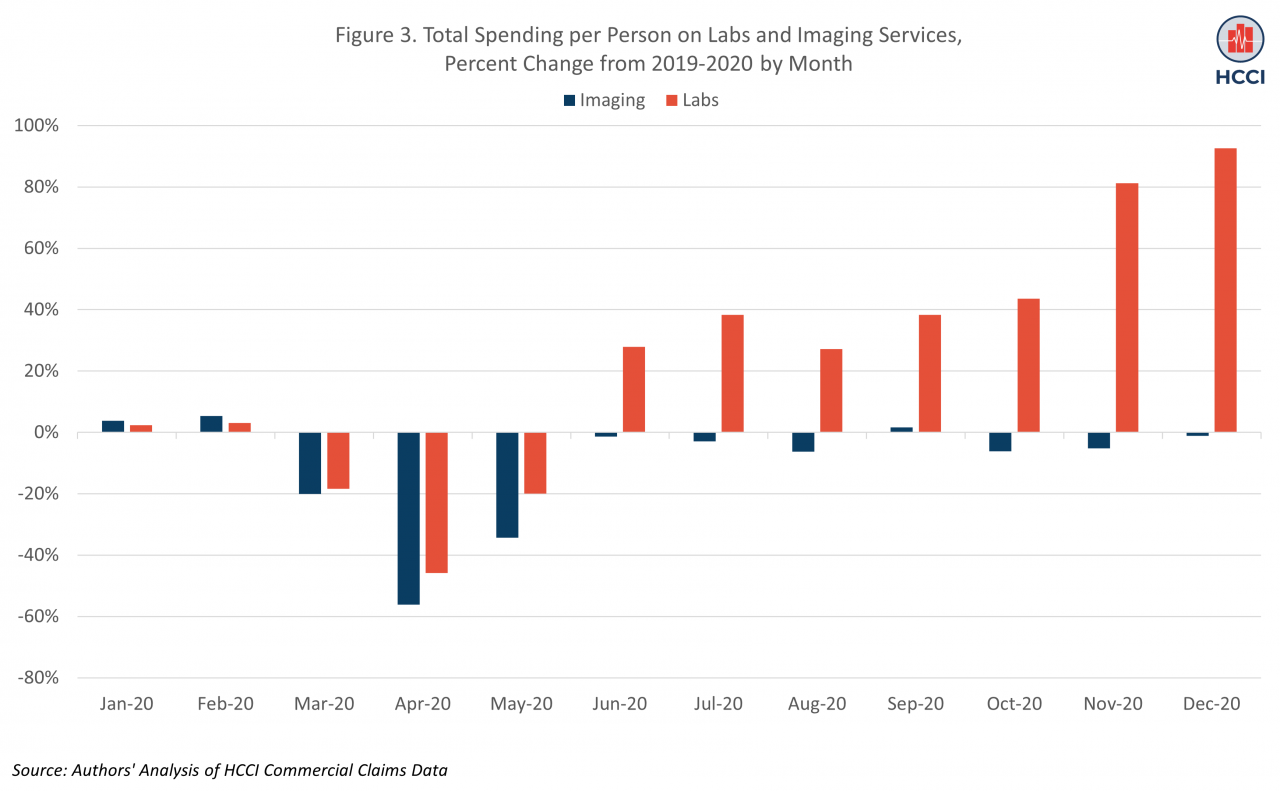
By June, however, spending on labs was 28% higher than in June of 2019, and by December, it was over 90% higher than in the same month in 2019. These trends reflect the increase in use of COVID testing over the year, as documented in other HCCI work. In contrast to lab services, spending on office-based imaging services, which typically require an in-person physician visit, and may be perceived as deferrable, was 56% lower in April 2020 than April of 2019. Like other non-COVID related services, use of imaging rebounded to reach comparable levels to 2019 by June 2020.
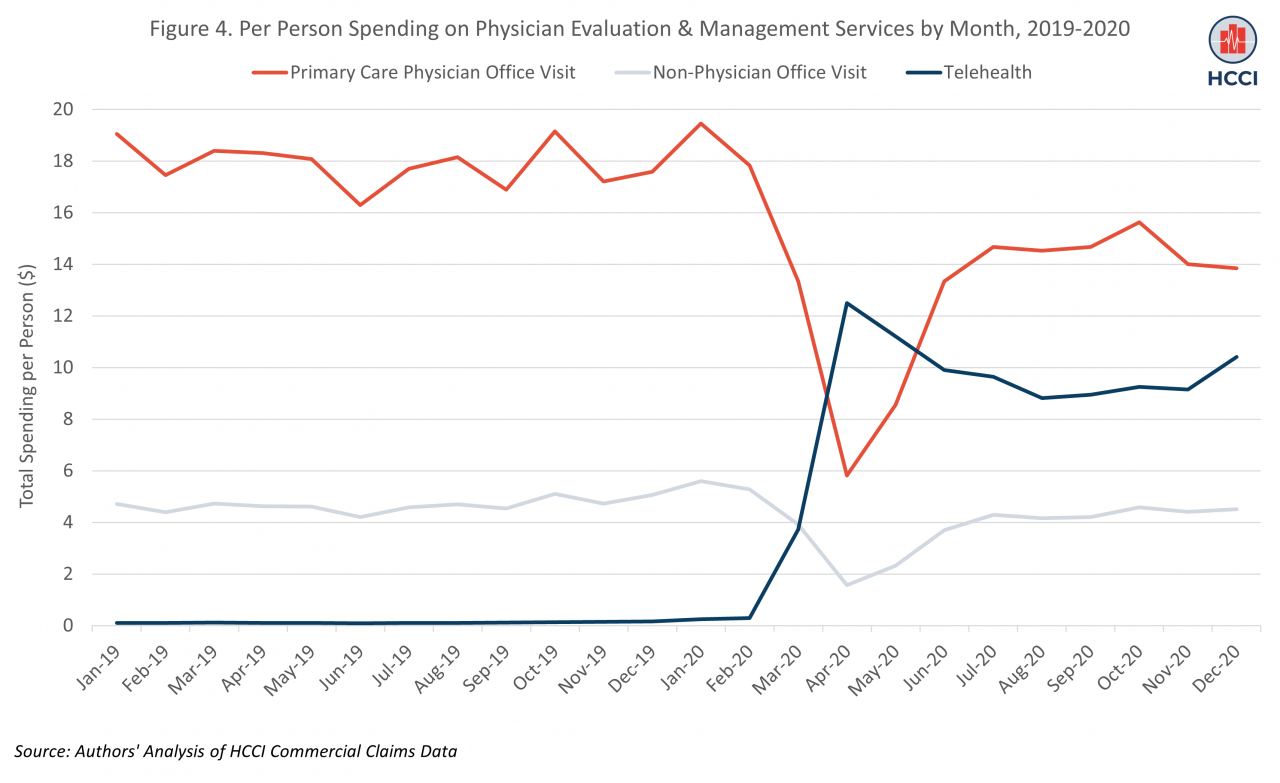
Over the five-year period captured in the Health Care Cost and Utilization Report, the largest growth in spending across all categories of care was for telehealth services. Spending on telehealth grew 250-fold between 2016 and 2020, with most of that growth between 2019 and 2020, consistent with other evidence showing the growth of telehealth in the early months of the pandemic as restrictions on coverage of these services were lifted during the public health emergency. After average monthly per person spending on telehealth of $0.12 in 2019, spending rose to a peak of $12.5 per person in April 2020 (Figure 4). This increase offset some of the drop in spending on in-person primary care visits, which fell to a low of $6 per person in April 2020 (compared to $18 per person in April of 2019). In person visits with non-physician clinicians also dropped in 2020 relative to 2019.
As Spending Declined due to Drop in Use of Services, Prices Continued to Rise
The COVID-19 pandemic was a shock to the health care system; at least one way in which this shock manifested was in a decrease in overall spending and spending in all medical categories of care (inpatient, outpatient, and physician/clinician services) among those with employer-sponsored health insurance in 2020. As shown in our main report, the decline in spending in 2020 was driven by dramatic decreases in use of health care services. As described here, the annual change was driven by declines in spending in the early months of the pandemic as stay-at-home and related regulations were introduced.
Even as use fell, prices for health care services grew approximately 4% In 2020, similar to year-over-year price growth over the past five years. We calculate the price for a service (or category of services, e.g., outpatient) as total spending (by insurer and patients) divided by utilization of that service. Therefore, price as we measure it is largely driven by payments negotiated between insurers and hospitals/physicians (insurer spending). These payments were set well in advance of 2020 and therefore do not incorporate pandemic-related effects, making it unsurprising that price growth is consistent with prior years.
Within a category of services, however, price may also capture changes in the mix of services provided. In 2020, because care was deferred, it may have been that those who did seek services had more complex needs, even within a category of services. For example, if people with uncomplex joint replacement needs skipped getting surgery, the set of patients who did receive inpatient musculoskeletal services may have been more likely to require more intensive, higher-priced services. If the mix of services included more services that had higher allowed amounts and out-of-pocket costs, this would lead to higher prices.
We observe price increases across nearly all categories of care in 2020. In some categories, prices reflect a change in service mix due to COVID. For example, the average price of a lab test increased 28% in 2020 after decreasing in 2018 and 2019, even as use of lab tests fell 5%. This increase in price was due to an increase in provision of COVID-19 tests, which are higher priced than most lab services (i.e., a COVID-induced shift in service mix within the lab category towards more expensive services). In other cases, price increases are a direct result of changes in payment policy. An example of this is the 85% increase in telehealth prices from 2019-2020, driven by an increase in reimbursement for these services across payers. In other cases, prices may be a function of market dynamics independent of COVID.
While the story of health care spending in 2020 is focused on the impacts of COVID-19, and in particular the declining use of many services, maintaining our attention on rising health care prices is critical in efforts to increase access to health care. Rising prices illustrate the ongoing challenges of health care markets and translate into high out-of-pocket costs for health care services, even for individuals with health insurance (e.g., when they are in the deductible phase of their coverage). Further, high prices raise overall spending which affects people through higher health insurance premiums as well as a range of other indirect effects (e.g., lower wages).
The value of a high-quality health care system has become even more evident over the past two years as we have collectively weathered what we hope will be a once-in-a-century pandemic. Going forward, the availability and affordability of health care services is critical in efforts to alleviate the effects of COVID-19, improve financial and clinical well-being, and prepare for and mitigate future health crises.