HCCI’s commercial claims dataset includes claims for over one-third of the population with health insurance through their job (employer-sponsored insurance, or ESI). There are a number of unique features of these data that make them valuable for answering important health care and health policy questions. One such feature is the 5-digit zip codes of ESI enrollees (i.e., where people live) and their health care providers (i.e., where their doctors and hospitals are located).
The availability of 5-digit zip of enrollee residence allows linkage to a range of geographic area level measures, including income, rurality, and measures of social risk such as the Social Vulnerability Index. HCCI has used many of these measures to, for example, characterize where ESI enrollees live, document disparities in prevention, screening, and treatment among ESI enrollees, and examine price variation for specific services.
Having both physician/hospital and enrollee zip codes allows for additional studies, including on health care access. For example, we can use the zip codes of where people live and where they get care to measure how far people travel for different kinds of care. Further, we can examine disparities in access by looking at how travel distances vary by where enrollees live (e.g., rural compared to non-rural).
To illustrate how enrollee and physician/hospital zip codes may be used in research, we show a brief analysis below of the distance that families travel for inpatient hospital care for their children, and how this distance varies among those who live in areas that are more or less vulnerable (per the Minority Health-Social Vulnerability Index) and areas that are rural compared to non-rural.
Over the past ten years, the share of hospitals with inpatient pediatric units in the U.S. has decreased by nearly 20%, related in part to financial pressures facing hospitals. Generally, reimbursement for children’s inpatient hospital stays is lower than for adults, which may contribute to hospitals’ decision to close pediatric units. These closures raise concerns that families may face barriers to accessing hospital care for their children, including having to travel farther for these services.
Families Travel, on Average, about 13 Miles for a Child’s Hospital Admission
We measured the average distance traveled for a child’s hospital admission as the distance between the enrollee’s zip code of residence and the zip code of the hospital where they received care. Distances between zip codes were from the NBER Zip Code Distance database, where they are calculated as great-circle distances based on central points in the zip code. All distances are reported in miles. Our results show that families travel, on average, about 13 miles for a child’s hospital admission. The average distance for inpatient care is within the range of distance standards for hospital care set by the government for health plans participating in the Exchanges to ensure network adequacy.
We also mapped enrollee zip code to publicly available data sources that are available at the 5 digit-zip-code level to examine how travel distance varied with (1) Minority Health Social Vulnerability Index (SVI) and (2) Rural-Urban Commuting Area (RUCA) status.
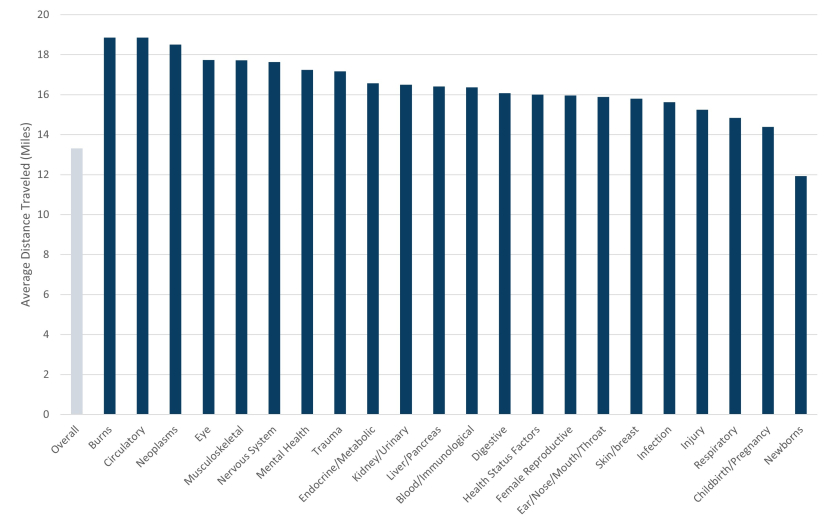
We looked at different categories of children’s hospital admissions and found that the average distance traveled varied across services from around 12 miles for newborn admissions (the most common type of children’s hospital admission) to almost 19 miles for a burn-related admission (Figure 1). While the average distance traveled is under 20 miles, there is substantial variation in how far families travel. Comparing the 10th and 90th percentiles of travel distances by service, we found distances at the high end were over 7 times higher than the low end in all service categories (see downloadable data).
Figure 1. Average Travel Distance for Pediatric Hospital Admissions by Type of Admission (2020)
The Average Distance Traveled for an Inpatient Admission was Higher Among Those Living in More Vulnerable Areas, but Differences were Small
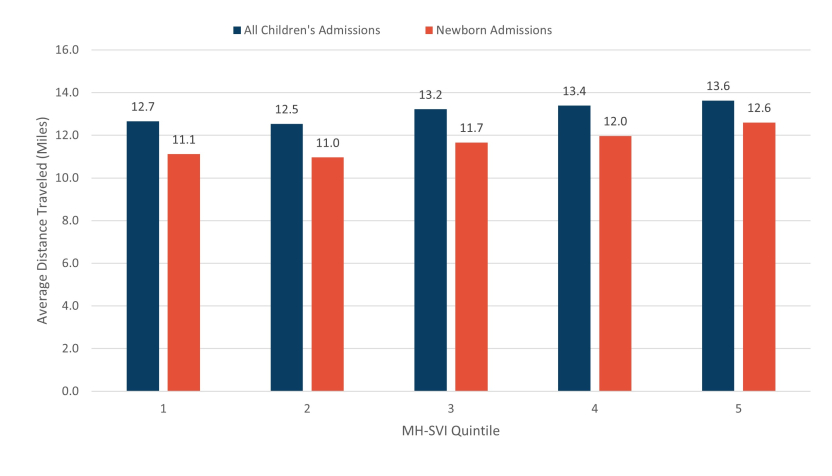
As shown in Figure 2, across all hospital admissions, the average distance traveled for a child’s hospital stay was about a mile more for families living in the most socially vulnerable areas (SVI value of 5) compared to those in the least socially vulnerable areas (SVI value of 1) (13.6 compared to 12.7). The travel distance differential between the most and least among socially vulnerable areas was largest for newborn admissions (1.5 miles; newborn admissions largely reflect births, so this finding suggests that people who live in the most socially vulnerable areas traveled 1.5 miles further to have a baby than people who live in the least vulnerable areas).
Figure 2. Average Travel Distance for Pediatric Hospital Admissions by Minority Health SVI Quintile (2020)
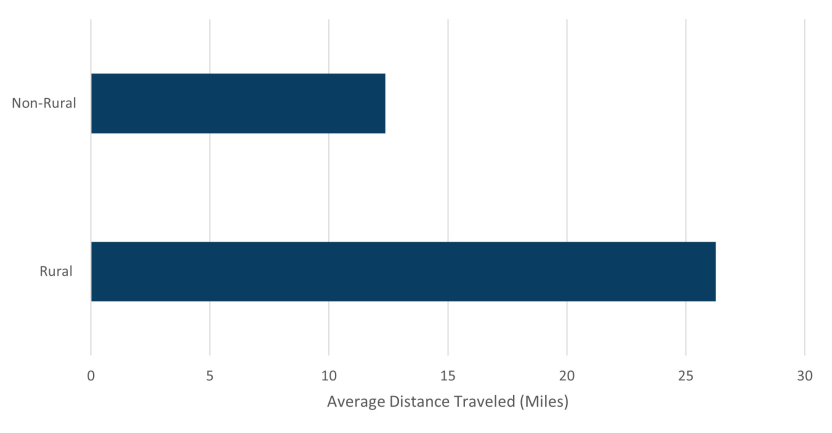
Families in Rural Areas Traveled over Twice as Far for Their Child’s Inpatient Admission than Families in Non-Rural Areas
Finally, we looked at travel distances for children’s hospitalizations in rural compared to non-rural areas. Rural Americans are more likely than people in urban and suburban areas to report that access to good doctors and hospitals is a major problem in their community. Our results show that children in rural areas travel more than twice as far for inpatient hospital care than children living in non-rural areas (26.3 miles vs. 12.4 miles, Figure 3).
Figure 3. Average Travel Distance for Pediatric Hospital Admissions for Rural and Non-Rural Patients (2020)