
Health care insurance claims data capture what health care services people use and how much they pay. These data are crucial for understanding the state of the U.S. health care system, including aspects that function well, those that need improvement, and how to achieve better health and access to care across populations. In this report, we look at the characteristics of individuals who have employer-sponsored insurance (ESI) and therefore whose use of and spending on health care services is captured in HCCI’s claims dataset. A deeper understanding of this population is important as a richer context for our work and other research using ESI data, including a more in-depth perspective on who is included in and excluded from our data.
We used HCCI’s commercial claims database, which includes claims for over one-third of the population with ESI, and the American Community Survey to answer two questions: (1) What portion of people who get health insurance through an employer live in more vulnerable areas? and (2) What portion of insured people who live in vulnerable areas get health insurance through an employer?
For this analysis, we defined vulnerability in three ways based on the zip codes where ESI enrollees live: (1) the social vulnerability of the zip code, (2) the percent of the population living in poverty, and (3) the rurality of the zip code.
Our results show that more than 40% of ESI enrollees live in areas of high vulnerability, as measured by the CDC’s Minority Health-Social Vulnerability Index (MH-SVI). In contrast, less than 15% of ESI enrollees live in areas with high poverty and in the most rural areas. Though a small proportion of ESI enrollees live in high poverty or the most rural areas, ESI plays an important role in many of these communities. When we examined what portion of insured people who live in vulnerable areas have ESI, we found that a higher share of the insured population is covered by ESI than Medicare and Medicaid in most zip codes, by at least 10 percentage points.
Individuals with ESI are a subset of the U.S. population, however studying this group is an important foundation for creating policies related to insurance markets and health care spending. ESI is frequently cited as the gold standard of coverage, and people with ESI represent a broad swath of the US population. Since ESI enrollees include individuals in the workforce, as well as children and partners who are covered as dependents, the ESI population includes people across the range of ages, industries, incomes, and geographies.
Not everyone has equal access to ESI benefits because some may be unable to work or do not have access to a job that offers health insurance benefits to their employees. Therefore, analyses based exclusively on the ESI population will not be fully representative of everyone in the U.S. and individuals enrolled in ESI may be systematically different from those who are not enrolled in ESI but are either covered by other sources or are in the 10% of the U.S. population that remains uninsured.
Still, understanding and strengthening ESI is a major component of efforts to achieve a more equitable and well-functioning system, since most people with health insurance receive coverage through an employer. There is robust evidence that a person’s zip code has implications for health outcomes, including life expectancy, due to a range of social, demographic, and structural factors. The health care system has the potential to bolster the health of communities. For example, timely use of health care services can reduce downstream hospitalizations, prevent the onset of chronic conditions, and provide the tools to manage long-term health issues, especially among those with insurance coverage. Given its role as a dominant insurer in socially vulnerable communities, the ESI system — including participating insurers, providers, and policymakers — can greatly influence the wellbeing of these communities.
Nearly Half of People Who Get Insurance Through Work Live in Vulnerable Areas as Measured by the Minority Health Social Vulnerability Index
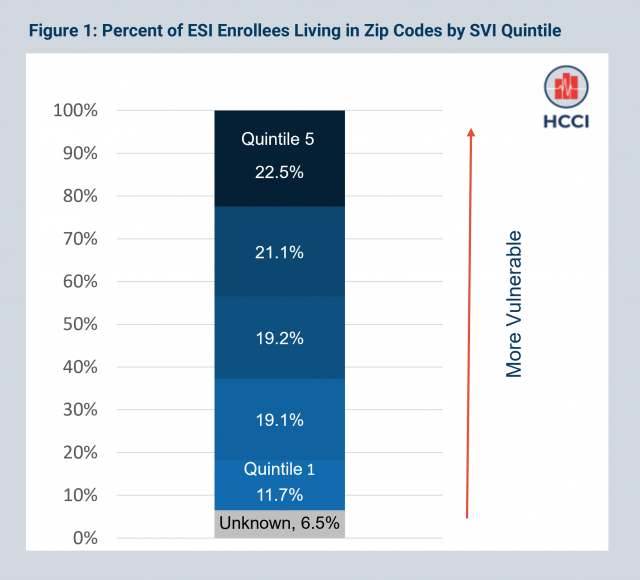
We examined the distribution of the ESI population across areas with varying levels of social vulnerability as defined by the Minority Health-Social Vulnerability Index (MH-SVI) (please see Measures section for full details on how measures were constructed). To do this, we divided 25,563 zip codes into five groups (quintiles), based on social vulnerability, with approximately 5,000 zip codes per quintile.
We found that over 40% of ESI enrollees in the HCCI data reside in zip codes that fall into the top two quintiles (most vulnerable) of MH-SVI scores. More than 22% of ESI enrollees reside in zip codes with the highest level of vulnerability. Overall, the percent of ESI enrollees increases with zip code level vulnerability. The difference between the percent of ESI enrollees who live in the most vulnerable areas and the percent who live in the least vulnerable areas is nearly 11 percentage points (Figure 1). Although the ESI population is a subset of the general population, our finding reflects the fact that most people — regardless of ESI enrollment — live in vulnerable areas.
ESI Enrollees Live in Areas that are Vulnerable Along Some Dimensions of the MH-SVI, but Not Others
The MH-SVI is a composite index that incorporates measures across six themes:
- Socioeconomic status
- Household composition and disability
- Minority status and language
- Housing type and transportation
- Health care infrastructure
- Medical vulnerability
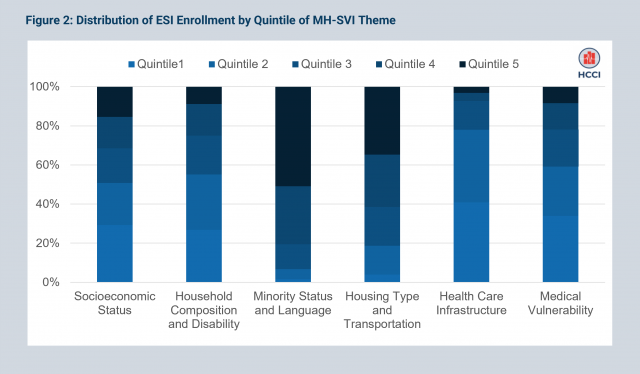
When we look at the distribution of ESI enrollees by theme, we find a more nuanced story of where ESI enrollees live than the composite index tells. ESI enrollees live in areas that are vulnerable along some dimensions but not others.
Nearly half (48%) of ESI enrollees live in the most vulnerable areas in terms of minority status and language and nearly one-third (32%) live in the most vulnerable areas in terms of housing type and transportation. This distribution reflects the fact that many ESI enrollees live in urban areas. In contrast, when it comes to socioeconomic status and household composition and disability, under 15% live in areas that are classified as most vulnerable. Most ESI enrollees also live in areas that are less vulnerable in terms of health care infrastructure (38% live in areas categorized in the lowest quintile of vulnerability based on infrastructure) and medical vulnerability (32% live in areas that have scores in the bottom quintile in terms of medical vulnerability) (Figure 2).
Less Than One-Fourth of ESI Enrollees Live in Vulnerable Areas as Measured by Poverty Level
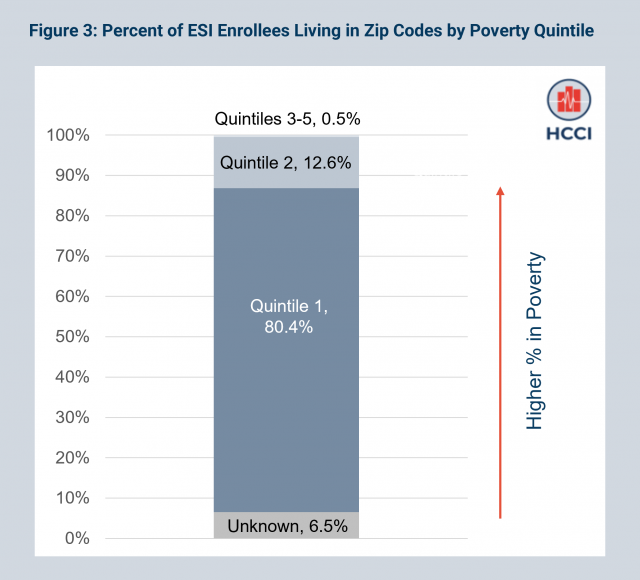
We assessed the share of ESI enrollees living in areas with varying levels of poverty. We found that only 13% of ESI enrollees live in areas with high poverty, defined as more than 20% of the population living in poverty. Overall, the percent of the ESI population decreases in areas with more poverty compared to areas with lower levels of poverty (Figure 3), with more than 80% living in areas with less than 20% poverty. The fact that most ESI enrollees reside in low poverty areas is consistent with the trend shown in the previous section, where we observe fewer ESI enrollees in the most vulnerable quintiles based on the MH-SVI’s socioeconomic status theme.
Under Two Percent of ESI Enrollees Live in the Most Rural Areas
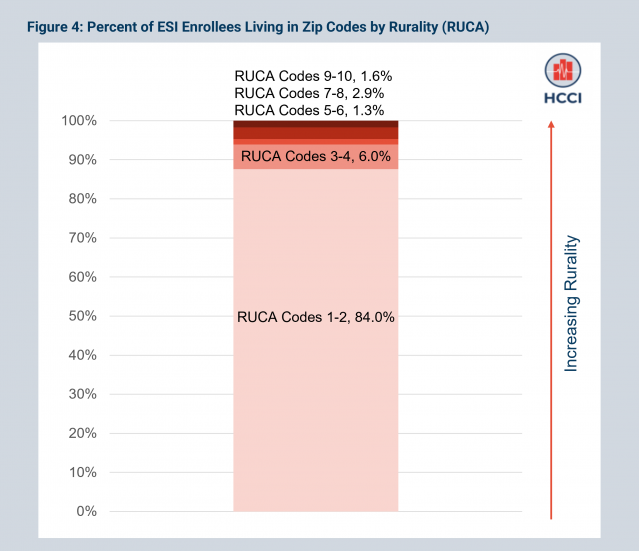
Next, we explored the distribution of the ESI population in areas according to Rural Urban Commuting Area (RUCA) code, which measures population density, levels of urbanization, and journey-to-work commuting. Rural areas tend to be more vulnerable than urban areas due to poverty, declining populations, geographic isolation (e.g., lower access to care), and weaker planning and administrative capacity. We grouped RUCA codes into five categories, ranging from least rural (RUCA codes 1 or 2) to most rural (RUCA codes 9 or 10).
Only 1.6% of ESI enrollees live in the most rural areas (RUCA codes 9 or 10) while nearly all ESI enrollees (84%) resided in large metropolitan areas (RUCA codes 1 or 2). Across all RUCA categories, the share of the ESI population decreases with increasing rurality (Figure 4). This finding (i.e., a small share of the ESI population resides in rural areas while most enrollees live in large metro areas) is consistent with the trend in the U.S., more generally, that an increasing proportion of the population resides in cities.
More People in Vulnerable Areas Get Insurance Through an Employer Than Any Other Source
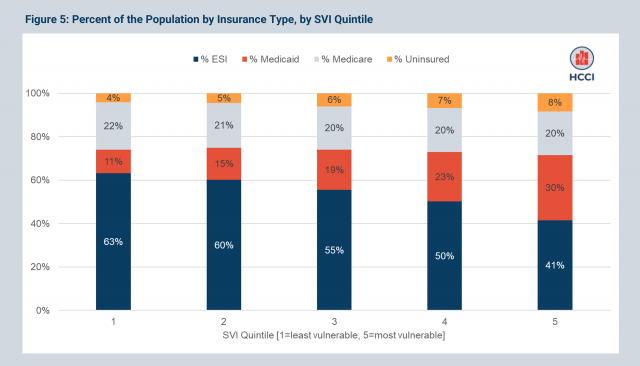
Another way to assess the role of ESI in different areas is to look at how much of the population in each area has coverage through ESI compared to other types of coverage (i.e., Medicare and Medicaid). We do this by looking at the percentage of the population covered by ESI, Medicaid, and Medicare for individuals in zip codes ranging from the least to the most vulnerable, using data from the U.S. Census American Community Survey (ACS). Our overall finding is that ESI is the primary source of insurance in vulnerable zip codes as measured by MH-SVI and in rural zip codes, but it is not the primary source of insurance in high-poverty zip codes.
We first examined the shares of the insured population with different types of coverage across areas from low to high social vulnerability as measured by the MH-SVI (Figure 5). Though the percent covered by ESI decreases with increasing vulnerability, as shown in the dark blue bars, ESI is the dominant insurer in zip codes across all quintiles of SVI by at least 10 percentage points. Even in the most vulnerable MH-SVI zip codes (quintile 5), ESI covers 41% of the population compared to 30% covered by Medicaid.
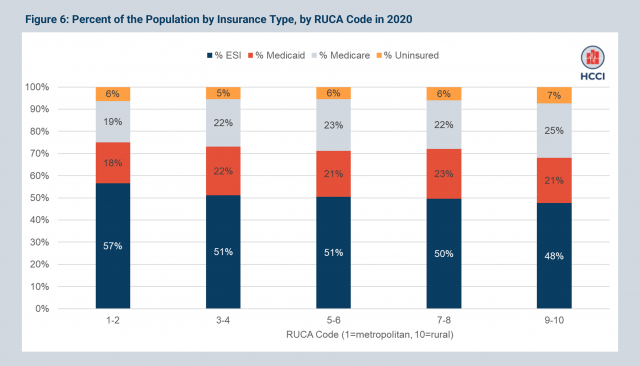
More People in Rural Areas Get Insurance Through an Employer Than Any Other Source
When zip codes are categorized by RUCA code (Figure 6), capturing rural and non-rural status, ESI is the dominant insurer across all areas; that is, the majority of the insured population in zip codes with all RUCA codes get health insurance through an employer.
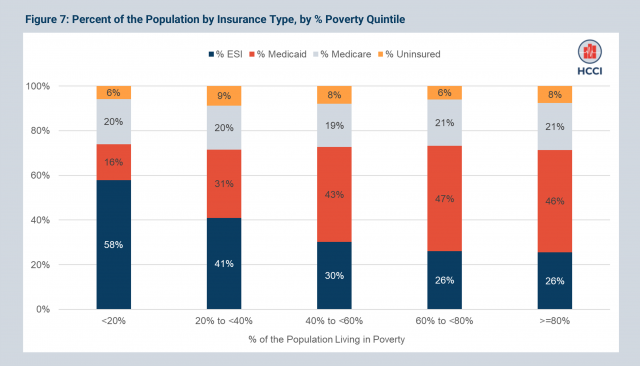
More Insured Individuals Have Coverage Through an Employer in Areas with Less Than 40% in Poverty; in Higher Poverty Areas, Medicaid is the Dominant Insurer
In contrast to the patterns observed with regard to social vulnerability and rurality, when we looked at insurance coverage in zip codes by their percent of the population living in poverty (Figure 7), we saw that ESI is the dominant insurer in areas with less than 40% in poverty, while Medicaid covers the highest share of the insured population in zip codes with over 40% of the population living in poverty. For example, in areas with 40% to 60% of the population living in poverty, 43% of the population was enrolled in Medicaid and 30% of the population was enrolled in ESI.
The ACS data provide a useful complement to the data on the characteristics of areas where ESI enrollees live shown in previous sections, which use the HCCI claims dataset. The ACS gives a broader view of the insured population, and how ESI fits into it, across areas that vary with respect to poverty, rurality, and social vulnerability. For example, though a small proportion of ESI enrollees live in rural communities, the ACS data allow us to see that most insured people who live in rural areas are still covered by ESI. A finding like this highlights that ESI-related policies and structures must be designed with the needs of rural residents in mind.
Data on ESI Enrollees Can Provide Insights About Health Spending, Use, and Outcomes Across Most Zip Codes, With Some Caveats
In this brief, we used HCCI’s commercial claims database to explore the characteristics of the ESI population along three measures related to the zip code in which they reside: social vulnerability, the percent of the population living in poverty, and rurality.
Our data show that more than 40% of ESI enrollees live in zip codes categorized as the most socially vulnerable, while less than 15% live in the most rural and high poverty areas. When comparing the share of ESI coverage to other insurers, however, the ESI population was larger than any other insured group across all levels of social vulnerability and rurality. Medicaid is the largest insurer in areas that have especially high poverty levels.
ESI enrollees are best represented in areas of high social vulnerability as defined by minority status and language and housing type and transportation. These dimensions of vulnerability are consistent with the fact that most socially vulnerable zip codes tend to be situated in cities. The majority of ESI enrollees reside in these highly populated areas, and ESI is the dominant provider of insurance in these areas, compared to Medicare and Medicaid.
Thus, while the population covered by ESI claims data is necessarily limited, and in particular, excludes individuals who may not have access to employment that offers coverage, the results shown in this report suggest that ESI data can provide insights into health care use and spending across nearly all communities, including in socially vulnerable areas. A more in depth understanding of the characteristics of ESI enrollees is important for us and other health policy researchers to better answer questions on health care use, spending, prices, quality of care, and other dimensions of health care and health policy in this large and diverse population.
Our results also suggest that policies aimed at or affecting the ESI population have the potential to shape a community’s health and wellbeing across a diversity of areas, including rural, metropolitan, and vulnerable communities. Given ESI’s important role across communities, these policies may also play an important role in exacerbating or ameliorating inequities in health care access and outcomes.
Sample and Measures
We examine characteristics of zip codes where ESI enrollees in the HCCI data live in 2020. Our sample includes 49,587,521 enrollees under the age of 65 in 2020.
Measure Descriptions:
RUCA Codes:
- 1: Metropolitan area core (primary flow within an urbanized area)
- 2: Metropolitan area high commuting (primary flow 20% or more to an urban area)
- 3: Metropolitan area core (primary flow 10% to 30% to an urbanized area)
- 4: Micropolitan area core (primary flow within an urban cluster of 10,000 to 49,999 (i.e., a large urban cluster))
- 5: Micropolitan high commuting (primary flow 30% or more to large urban cluster)
- 6: Micropolitan low commuting (primary flow 10% to 30% to large urban cluster)
- 7: Small town core (primary flow within an urban cluster of 2,500 to 9,999 (i.e., a small urban cluster)
- 8: Small town high commuting (primary flow 30% or more to a small urban cluster)
- 9: Small town low commuting (primary flow 10% to 30% to a small urban cluster)
- 10: Rural areas (primary flow to a tract outside an urban area or urban cluster)
SVI Themes and Included Measures:
- Socioeconomic Status: % Below poverty, % Unemployed, Per capita income, % No HS Diploma
- Household composition and disability: % aged 65, % aged <18, % older than age 5 with a disability, % single parent households
- Minority status and language: % minority (individual measures for American Indian/Alaska Native, Asian, African American, Native Hawaiian/Pacific Islander, Hispanic or Latinx, Some Other Race), % speak English less than “very well” (individual measures for Spanish speakers, Chinese speakers, Vietnamese speakers, Korean speakers, Russian speakers)
- Housing Type and Transportation: % multi-unit structures, % mobile homes, % crowding, % no vehicle, % group quarters
- Health Care Infrastructure and Access: # of hospitals, # urgent care clinics, # pharmacies, primary care physicians per 100,000, % uninsured
- Medical Vulnerability: % households with no internet access, prevalence cardiovascular disease, prevalence Chronic respiratory disease, prevalence obesity, prevalence diabetes