The 2010 HCCI Health Care Cost and Utilization Report is the first report of its kind to track changes in expenditures and utilization of health care services by those younger than 65 covered by employer sponsored, private health insurance (ESI). This report assesses the levels and changes in prices and utilization (including changes in the mix of services) focusing on 2009 and 2010.
This report is also the first of what will be an ongoing series of reports from HCCI. Future reports will provide updated numbers as they become available and focus on additional aspects of health care costs and utilization.
Key Findings
- Per capita health spending among people under 65 is growing moderately, up 3.3 percent from the previous year but still nearly three times the rate of general inflation.
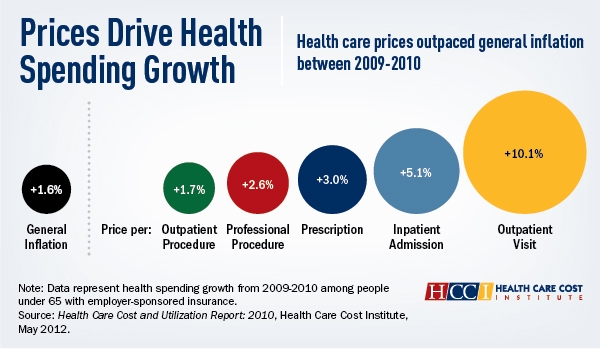
- Higher spending was mostly due to price increases, rather than changes in the use of health care services: Prices for hospital admissions, outpatient care and prescription drugs all grew at a much faster rate than general inflation in 2010.
- Health care spending grew fastest among those who are 18 and younger.
Rising prices for care were the chief driver of health care costs for privately insured Americans in 2010, according to the first report from the newly formed Health Care Cost Institute (HCCI). The per capita spending on inpatient and outpatient facilities, professional procedures, and prescriptions drugs rose 3.3 percent in 2010 for beneficiaries under age 65 with private, employer-sponsored group insurance. HCCI data show that this 3.3 percent increase follows spending increases in 2008 (6.0%) and 2009 (5.8%). Hospital and ambulatory care facility prices rose by 5.1 and 10.1 percent, respectively, in 2010. Increases in facility prices were offset by decreases in the number of inpatient admissions (-3.3 %) and use of outpatient facilities (-3.1%). HCCI confirmed 2010 prices for the privately insured grew more than utilization after accounting for changes in the mix of medical services provided in hospitals (0.7%) and outpatient facilities (4.6%).
The Health Care Cost and Utilization Report: 2010 is based on de-identified, Health Insurance Portability and Accountability Act (HIPAA) compliant data sets from three billion health insurance claims provided by Aetna, Humana, and UnitedHealthcare, three of the nation’s largest health plans. Future reports from HCCI will include data from Kaiser Permanente. The payers have agreed to share their data with HCCI to help researchers study what influences the use and cost of health care services in the United States. Findings from the 2010 report reflect the national health care spending of more than 33 million privately insured people with employer-sponsored group health insurance.
“For the first time we have comprehensive data on the privately insured. This lets us develop a clearer picture of what is truly driving health care spending in the United States,” says HCCI Governing Board Chairman Martin Gaynor, PhD, E.J. Barone Professor of Economics and Health Policy at Carnegie Mellon University. “Health care spending is a critical problem—it’s not an exaggeration to say that if we solve the health care spending problem we solve our fiscal problems.”
A More Complete Picture of Spending
The report examines trends in inpatient and outpatient care, professional services, and prescription drugs by the privately insured. HCCI looked at per capita spending, prices paid per service, out-of-pocket spending, utilization, and the mix or intensity of services used.
HCCI determined per capita spending on health care services averaged $4,255 in 2010, a 3.3 percent increase from 2009. Per capita expenditures varied, with $8,327 paid for people aged 55-64, and $2,123 for people under 18 in 2010. Per capita spending among the youngest cohort – people 18 and under – grew faster than any other age group under age 65. Overall health spending among the estimated 156.5 million people with employer-sponsored group insurance increased, rising 2.5 percent to $666.1 billion, consistent with recent reports on health spending.
“HCCI’s unprecedented effort to drill down into the underlying drivers of costs will help set the country on a more sustainable economic path,” says Bradley Smith, President of the Society of Actuaries. “This report will be a great help to the work we do to analyze and estimate the true drivers of health care spending.”
HCCI was launched in September 2011 as a nonprofit entity with a public mission of making these data available for research. HCCI has produced the first comprehensive picture of health care spending for the privately insured. The 2011 update of the current report will be available in fall 2012, making it one of the earliest available assessments of health care spending in 2011.
“We hope this report will help people get a much clearer picture about what triggers health care growth and spending,” says HCCI Executive Director David Newman. “Having this amount of data allows us to drill down and examine the underlying causes of health care spending among a population that hasn’t been studied extensively in a way that can provide answers to important questions.”
Highlights of the report:
Cost Sharing. Out-of-pocket per capita spending increased 7.1 percent in 2010 to $689. Cost sharing rates between payers and beneficiaries remained relatively stable, with beneficiaries contributing 16.2 percent of average per capita spending.
Inpatient-Outpatient Facility Trends. The average facility price paid for a hospital stay was $14,662 in 2010, a 5.1 percent increase over 2009. The price for an emergency room visit climbed to $1,327 in 2010, an 11 percent hike. The average out-of-pocket price of a hospital stay rose 10.7 percent from $632 in 2009 to $700 in 2010.
Prescription Drugs. Prescription drug prices grew on 3 percent overall from an average of $80 per prescription in 2009 to $82 in 2010. However, brand name drug prices increased 13 percent from 2009 to 2010, while generic drug prices decreased by 6.3 percent.
Professional Services. The overall price of professional procedures that include doctor visits, lab tests, and diagnostic imaging, increased 2.6 percent. Payments for office visits—to both primary care and specialist providers—grew by more than 5 percent.
Utilization Trends. Overall use of health care services declined in 2010. Usage dropped by more than 5 percent for medical inpatient admissions, emergency room visits, primary care provider office visits, and radiology procedures. On average, each insured person filled more than nine prescriptions in 2010. The number of brand name prescriptions dropped by nearly 4 percent, while the number of generic prescriptions increased by 2.5 percent.