
Among people who get health insurance from their employers (56% of the population in 2017), prescription opioid use peaked in 2010/2011 and declined every year from 2012 to 2017. In a new study using the Health Care Cost Institute’s commercial claims data from 2008 to 2017, we observed a decline regardless of how utilization was measured. We also found that utilization trends were driven by three opioids: hydrocodone (Vicodin), oxycodone short acting (Percocet), and tramadol. In looking at state-level variation, we saw decreases in overall opioid utilization, a likely result of state-level policy interventions and provider awareness.
In 2011, in the midst of a rise in opioid use disorder and opioid-related deaths, the Center for Disease Control declared an opioid “epidemic” in the United States. Since then, extensive media coverage and legislative interest have caused greater scrutiny of opioid prescribing patterns. The CDC, CMS and others have reported trends in prescription opioid utilization using pharmacy and Medicare data. These reports found a decrease in overall opioid prescribing since 2012, but less work has been done to understand the opioid prescribing trends for people with commercial health insurance.
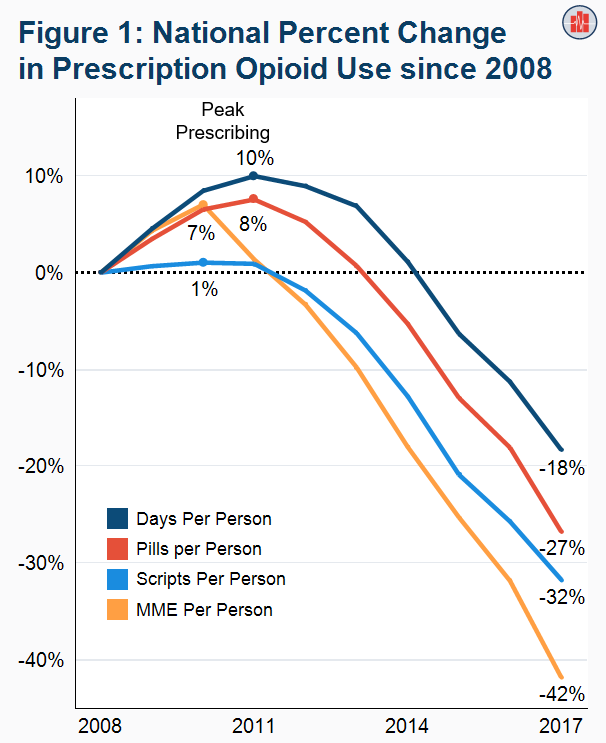
We observed declines in prescription opioid use by four measures.
We assessed utilization of prescription opioids by four metrics. Over the ten years studied (2008 to 2017), we found (Figure 1):
- Filled days fell 18%. Peak use occurred in 2011.
- Pills (tablets for most opioids; patches for fentanyl) fell 27%. Peak use occurred in 2011.
- Prescriptions filled fell 32%. Peak use occurred in 2010.
- MME (morphine milligram equivalents, a common measure of opioid potency) fell 42%. Peak use occurred in 2010.
Three opioids drove utilization trends from 2008 to 2017.
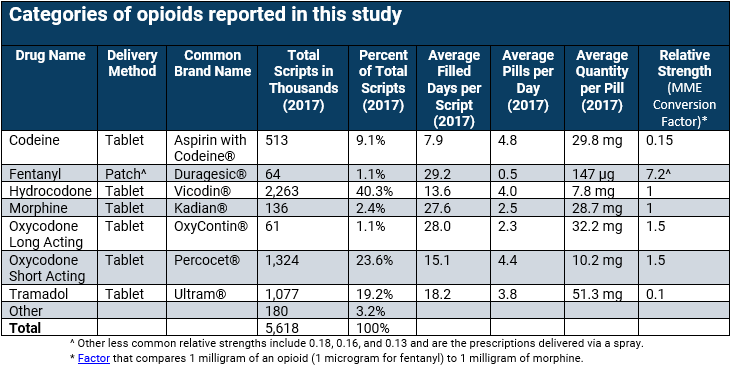
The three opioids with the greatest utilization in 2017 were hydrocodone, oxycodone short acting, and tramadol (Figure 2). In addition, oxycodone long acting saw significant changes in use.
- These drugs made up 86% of all pills for opioids in 2017, an increase from 77% in 2008.
- Hydrocodone (brand name Vicodin®) was the most commonly prescribed opioid representing 40.3% of prescriptions in 2017 as compared to 51.3% in 2008. Hydrocodone had the largest decline in use with 4.5 pills per person.
- Oxycodone long acting (brand name OxyContin®) accounted for 2.9% of prescriptions in 2008 and dropped to 1.1% in 2017. Oxycodone long acting use dropped by 0.9 pills per person, the largest percent decrease in use.
- Tramadol (brand name Ultram®) represented an increasing share of opioids prescribed with 19.2% of prescriptions in 2017 as compared to 9.4% in 2008. Tramadol use increased by 0.8 pills per person.
- Oxycodone short acting (brand name Percocet®) was the second most commonly prescribed opioid in 2017 with 23.6% of prescriptions. Oxycodone short acting use fluctuated during the years of interest, but overall dropped by 0.2 pills per person.

Methods Note
Using the Health Care Cost Institute claims database, we identified all individuals from 2008 to 2017 who were under 65 years of age, covered by employer-sponsored health insurance, and who did not have a cancer diagnosis or hospice claim within a year. We excluded patients who moved to different states within a month or were enrolled in multiple health plans within a month. Using the Center for Disease Control’s most current cumulative list of opioids at the National Drug Code (NDC) level, we then identified individuals with at least 1 claim. We excluded buprenorphine (used mainly to treat opioid addiction) and any opioids that did not appear in any claims from 2008 to 2017. Our denominator is average member months (total member months of all qualifying individuals within a year, divided by 12) to account for changes in year-to-year total enrollment. In the text, we refer to our utilization amount as “per person” which is the numerator of interest (aggregated sum of a specified utilization metric) divided by (average member months multiplied by 12).
Our analysis of utilization specifically measured “pills” which measures the typical number of tablets, patches, or otherwise specified delivery method supplied to patients. The other utilization metric is filled days which is the estimated amount of days a drug should last as written on a prescription label. The potency of opioids differs significantly across the commonly prescribed classes, so we also examined morphine milligram equivalents (MMEs) which standardizes strength across all opioids. MMEs are calculated by multiplying the (units of drug) by the (gram specific strength) by the (MME conversion factor).
The ‘other’ category, which accounts for a small share of total opioid use, includes butorphanol, dihydrocodeine, hydromorphone, levorphanol, meperidine, methadone, opium, oxymorphone, pentazocine, propoxyphene, and tapentadol. Drug categories display the combined results for the short acting and long acting prescriptions for all opioids except oxycodone. The major change in composition of the other category from 2008 to 2011 was the elimination of propoxyphene in November 2010 due to unintended cardiac issues related to the drug.
Data was suppressed at the state level for Hawaii and Vermont due to low data availability. Certain drug categories were condensed into the “other” category for states where opioid utilizer counts were low. Opioid utilization at the national level contains data from all 50 states.