Topics
Insulin Use Explains Variation in Level, but not Growth, of Out-of-Pocket Spending on Insulin Products
We previously published two blogs discussing trends in out-of-pocket spending on insulin products. First, we presented data illustrating how average monthly out-of-pocket spending in 2017 varied considerably by month, particularly for individuals enrolled in consumer-directed health plans (CDHPs) that carry higher deductibles. Second, we examined the relationship between increasing point-of-sale prices between 2012 and 2017 and higher out-of-pocket spending on insulin products at the beginning of the calendar year for individuals with type 1 diabetes. In this post we explore trends in insulin use over the same period for individuals enrolled in CDHPs and non-CDHPs, and how changes in out-of-pocket spending were related to changes in use.
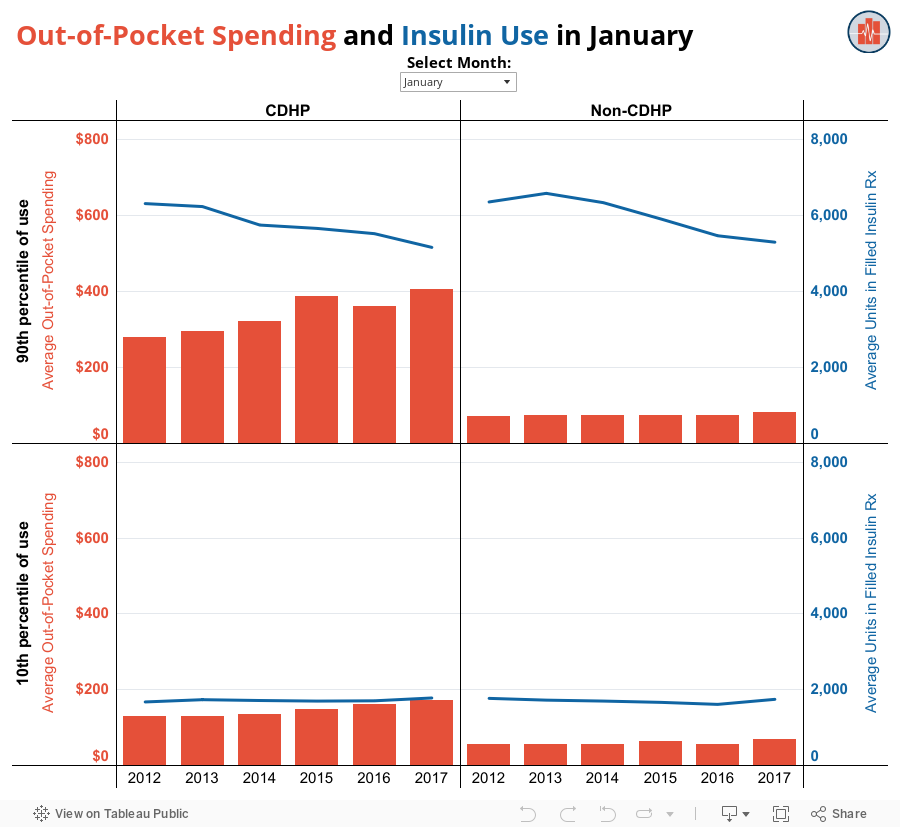
Individuals enrolled in CDHPs and non-CDHPs filled prescriptions containing very similar amounts of insulin across all months of all years. Among enrollees in each type of plan, those with higher insulin use had higher out-of-pocket spending. These differences were more pronounced early in the year and among enrollees in CDHPs. CDHP enrollees in the 90th percentile of insulin use paid $404 out-of-pocket in January 2017, while those in the 10th percentile of use paid $172.
As we saw previously, early year out-of-pocket spending grew rapidly from 2012 to 2017, particularly in January. Not surprisingly, individuals enrolled in CDHPs with the highest insulin use experienced the largest increase on average. For individuals in the 90th percentile of insulin use, January out-of-pocket spending on insulin was $126 higher (an increase of 45%) in 2017 compared to 2012. This increase in out-of-pocket spending was not driven by higher use. As seen in the figure below, among the highest users, prescriptions filled in 2017 contained fewer units of insulin than those filled the same month of 2012.
Note, decreases in the number of units of insulin between 2012 and 2017 do not necessarily indicate that individuals were using less than prescribed. In presenting these descriptive findings, we do not control for changes in the composition or health status of the population of people with type 1 diabetes in our sample. We can, however, conclude that people paid more out-of-pocket for less insulin in January 2017 compared to January 2012.
To explore monthly out-of-pocket spending and insulin use trends by year and health plan type for individuals with relatively high and low insulin use, select the month of interest in the dashboard below.
-
Methods Note
We used HCCI medical and pharmacy claims data to identify individuals with type 1 diabetes and calculate measures of out-of-pocket spending and use. This analysis restricted to individuals who were enrolled continuously in employer-sponsored coverage for the entire calendar year and filled at least two prescriptions for insulin. We exclude individuals in the top and bottom percentile of use each year. We express use in terms of units of insulin to standardize across products that differ in concentration and volume. Percentiles of use are defined based on the total number of insulin units contained in prescriptions filled during the calendar year. Monthly data reflects average values for individuals who filled prescriptions in that month. Since not all individuals filled at least one prescription for an insulin product in each month, the sum of the monthly measures does not equate to annual totals.
Stay Informed
When you subscribe to the blog, we will send you an e-mail when there are new updates on the site so you wouldn't miss them.
©
2025
Health Care Cost Institute Inc. Unless explicitly noted, the content on this website is licensed under a Creative Commons Attribution Non-Commercial No Derivatives 4.0 License
