Topics
ER spending increased 85%, driven by price increases for the most severe cases (2009-2015)
Medical bills from the Emergency Room (ER) are a mystery to many patients in the US health system. From incredibly high, varying charges to surprise bills resulting from in/out of network confusion, many Americans have no idea what to expect when it comes to the cost of this necessary service. Recently, Vox reporter, Sarah Kliff, has begun collecting ER bills in an attempt to "bring transparency to these extremely common but little understood fees". To further the discussion, HCCI is releasing its first freely available data download! Using HCCI's vast commercial claims dataset, we examined the 5, successive Current Procedural Terminology (CPT) codes for an ER visit which are designed to capture the level of severity and complexity of the ER visit. Analyzed collectively, we used these codes to explore how spending, utilization, and prices for ER visits have changed from 2009 through 2015.
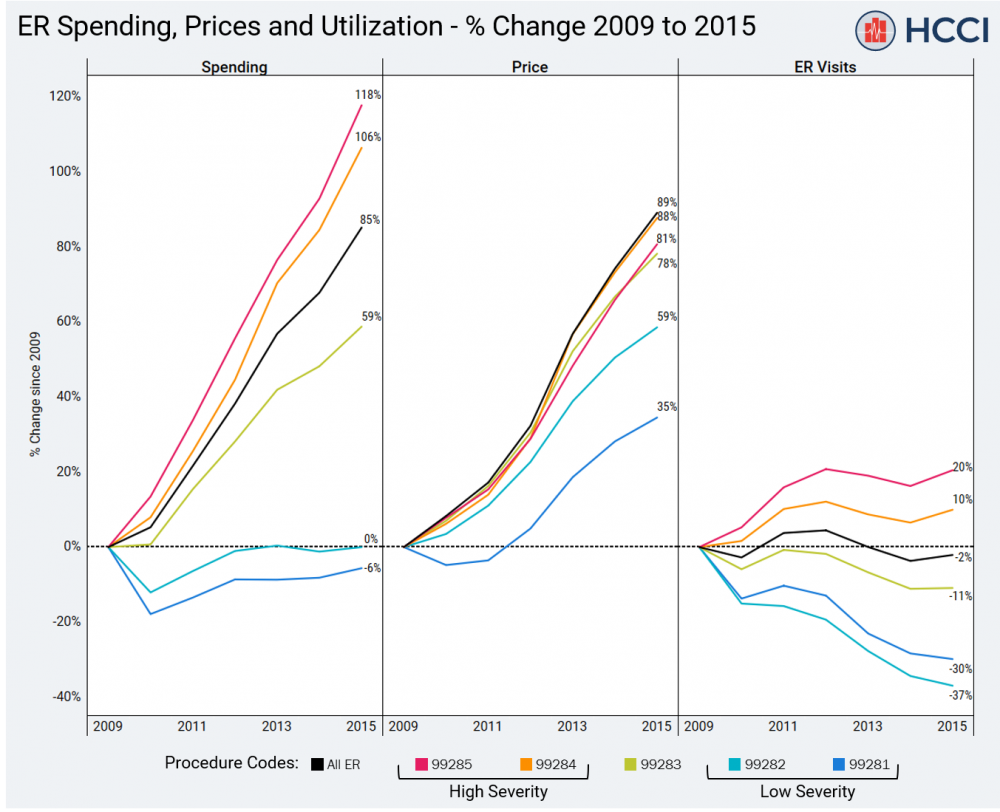
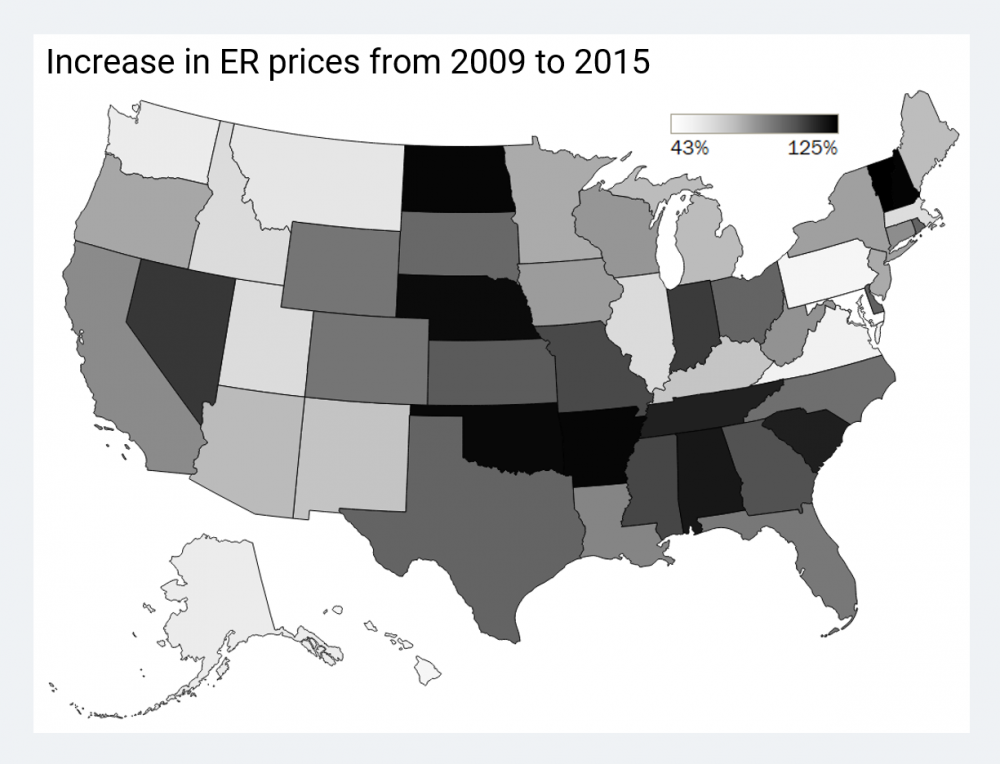
Spending per member on all ER visits increased 85% between 2009 and 2015, largely due to the more than 100% growth in spending on high severity cases. ER spending growth was driven by price increases. High severity visits had the highest prices and the greatest price growth; the price for the most severe ER visit rose over $400, from $498 in 2009 to $900 in 2015. While overall use of the ER remained constant, there was a significant shift in case mix from low to high severity visits – further magnifying the effects of high severity price increases on spending. The average price of an ER visit increased in every state. Some states saw price increases well over 100%, while price growth was half the national rate in others. The downloadable dataset alongside this post allows for all types of state-level comparisons across years, severities, and measures.
-
Methods Note
The measures reported are based on ER procedure codes (CPT codes 99281-99285) for HCCI’s ESI population. They do not include the costs of other services patients received during their visit to the ER such as the cost of an injected drug. Therefore, these price and spending measures may not capture the entirety of what is typically thought of as an ER visit. Patients may often receive multiple ER CPT codes during the same visit. The yearly proportion of visits with multiple codes remained constant throughout the study period. When aggregated to the visit level, with each visit classified as high, dual, or low severity depending on the code(s) billed, we continued to see an increase in high severity, decrease in low severity, alongside a decline in overall ER visits. Average spending and prices are calculated from the actual amount paid for each claim line containing one of the 5 ER CPT codes. For more information about the HCCI dataset and the methodology of the calculations, see the Methodology page on the HCCI website.
Stay Informed
When you subscribe to the blog, we will send you an e-mail when there are new updates on the site so you wouldn't miss them.
©
2025
Health Care Cost Institute Inc. Unless explicitly noted, the content on this website is licensed under a Creative Commons Attribution Non-Commercial No Derivatives 4.0 License
