
Primary care offers patients a critical connection point to the health care system. With contact, continuity, comprehensiveness, and coordination as its base1, primary care has been shown to improve health outcomes and population health, reduce health disparities, and save health care dollars. Despite the virtues and benefits of primary care, it seems to be getting harder to access. In 2025, there were 7,901 primary care health professional shortage areas. A recent report found that primary care physicians per capita declined between 2012 and 2021, and fewer trainees chose to pursue primary care than specialty care over the same period.
In response, a number of states are innovating to increase investment in primary care. By one estimate, nearly 20 states have taken action to improve primary care with initiatives ranging from defining and measuring primary care to setting specific primary care spending targets.
This analysis assesses what portion of total health care spending is dedicated to primary care, in alignment with many of the primary care spending targets that are expressed as a percentage of total health care spending. We defined the percentage of primary care as the portion of ambulatory spending rendered by primary care providers (PCPs) relative to total medical and prescription spending among people with Employer-Sponsored Insurance (ESI) and Medicare Fee-for-Service (FFS) between 2018 and 2022.
The results presented below are based on a narrow definition of primary care provider based on provider specialty. We conducted the same analysis using an expanded list of specialties, (e.g., obstetrics and registered nurses and other allied practitioners). As expected, the share of primary care spending was higher using the broader definition. Otherwise, the patterns observed with the narrow definition also applied to the broader definition. The results of the analysis using both definitions are available in the downloadable data.
Approximately 4% of spending went to primary care in 2022
Nationally, among people with ESI, primary care made up 4.39% of total medical and prescription spending in 2022. Primary care spending in Medicare FFS was lower than ESI, at 3.86% of total spending.
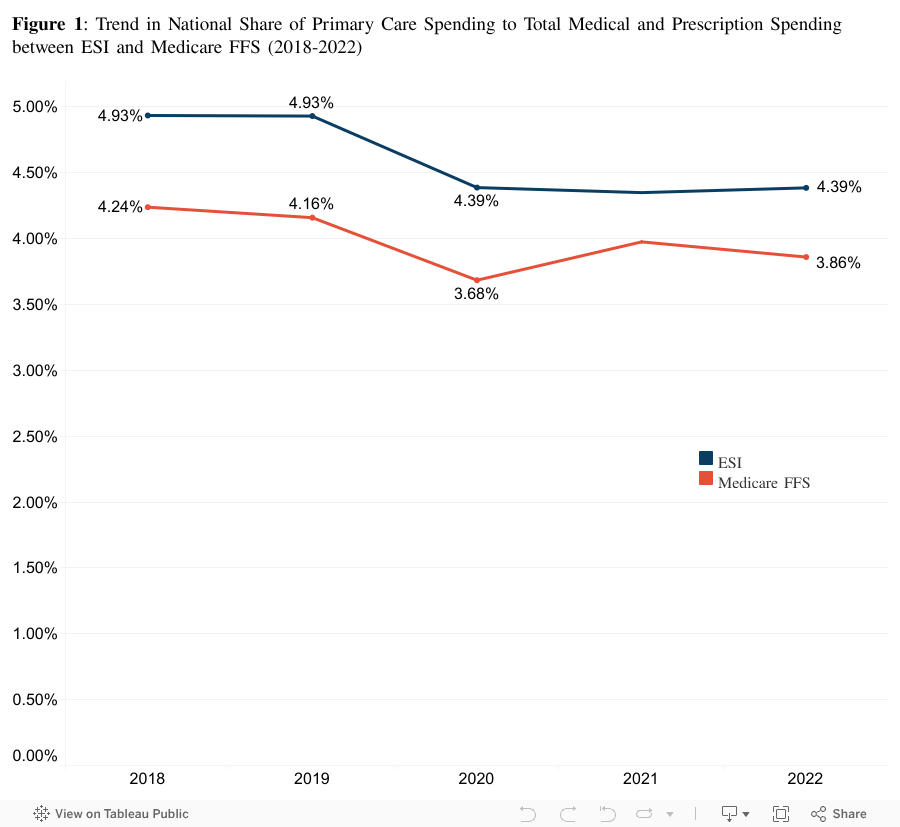
In both ESI and Medicare FFS, the share of primary care spending decreased slightly from 2018 to 2022 (Figure 1). The share of primary care spending in ESI decreased by 11% (from 4.93% to 4.39%) while the share in Medicare decreased 9% (from 4.32% to 3.94%).
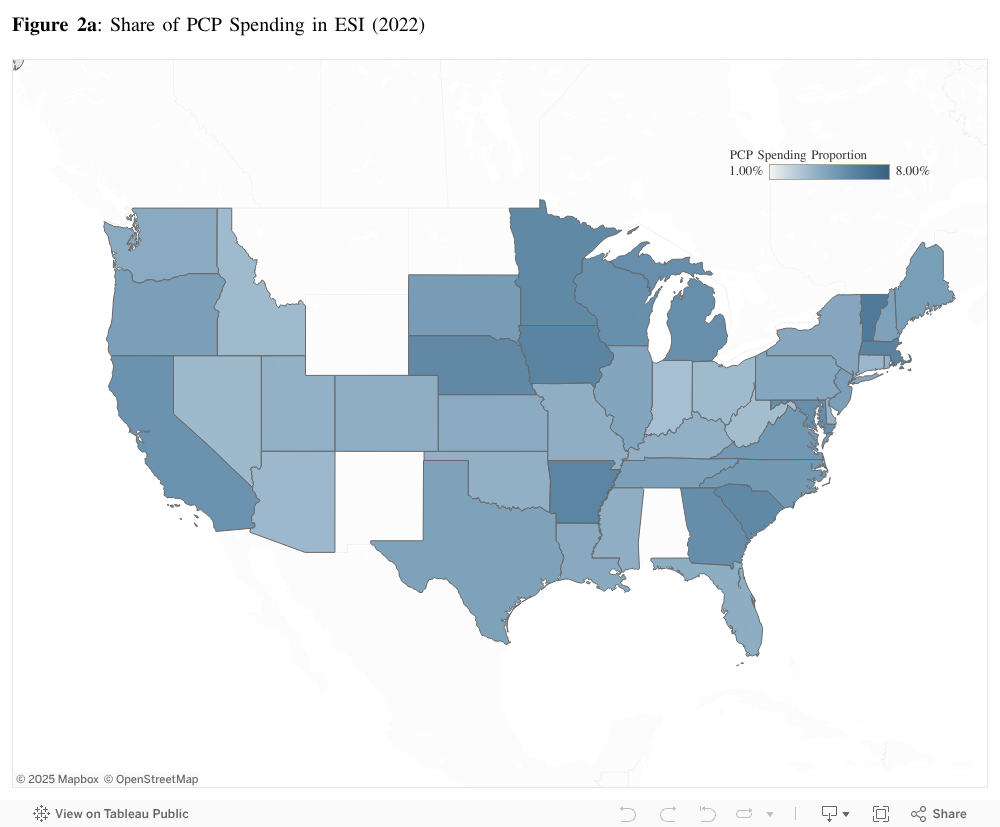
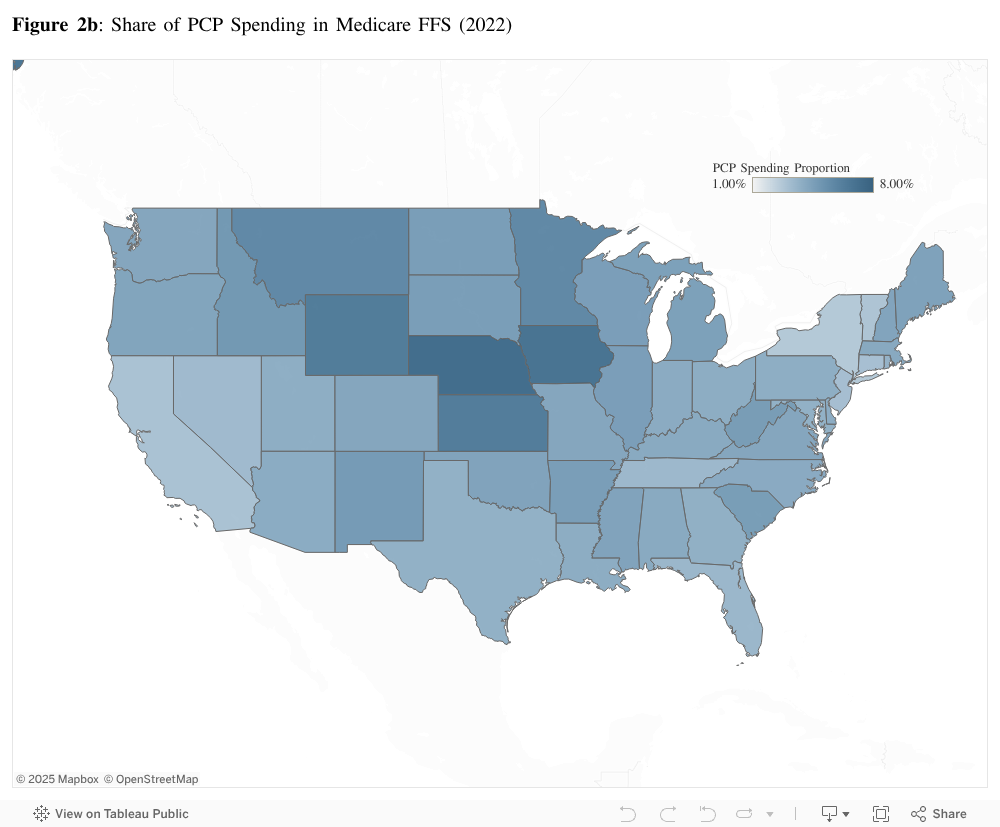
Underlying the national averages was wide variation among states. In 2022, among people with ESI, the share of primary care spending ranged from 1.54% in Alaska to 6.47% in Vermont (Figure 2a). Among the Medicare FFS population, the share of primary care spending ranged from 2.70% in New York to 7.41% in Nebraska (Figure 2b). Generally speaking, states in the upper Midwest were associated with higher shares of primary care spending among both insured populations in 2022.
From 2018 to 2022, the share of primary care spending among the ESI population decreased among 43 of the states, including the District of Columbia, in our analysis. The state of Vermont and District of Columbia were the only states in our study that saw an increase. Over the same period, the share of Medicare FFS PCP spending decreased in 48 states (including the District of Columbia). Only the states of Kansas, Minnesota, and District of Columbia saw an increase in the proportion of primary care spending from 2018 to 2022 in the Medicare FFS population.
Variation in the share of spending could be due to differences in the amount spent on primary care services, the cost of health care services overall, or a combination of both, so these results should be interpreted carefully.
Higher share of PCP spending found in rural areas
Nationally, rural areas saw a greater share of primary care spending than their urban counterparts (Figure 3). In 2022, among people with ESI in rural areas, primary care spending made up 4.56% of total spending compared to 4.37% of spending in urban areas. Medicare FFS had a similar pattern, but the difference was much starker. In 2022, among people with Medicare FFS who live in rural areas, 6.93% of spending went toward primary care compared to 3.46% in urban areas.
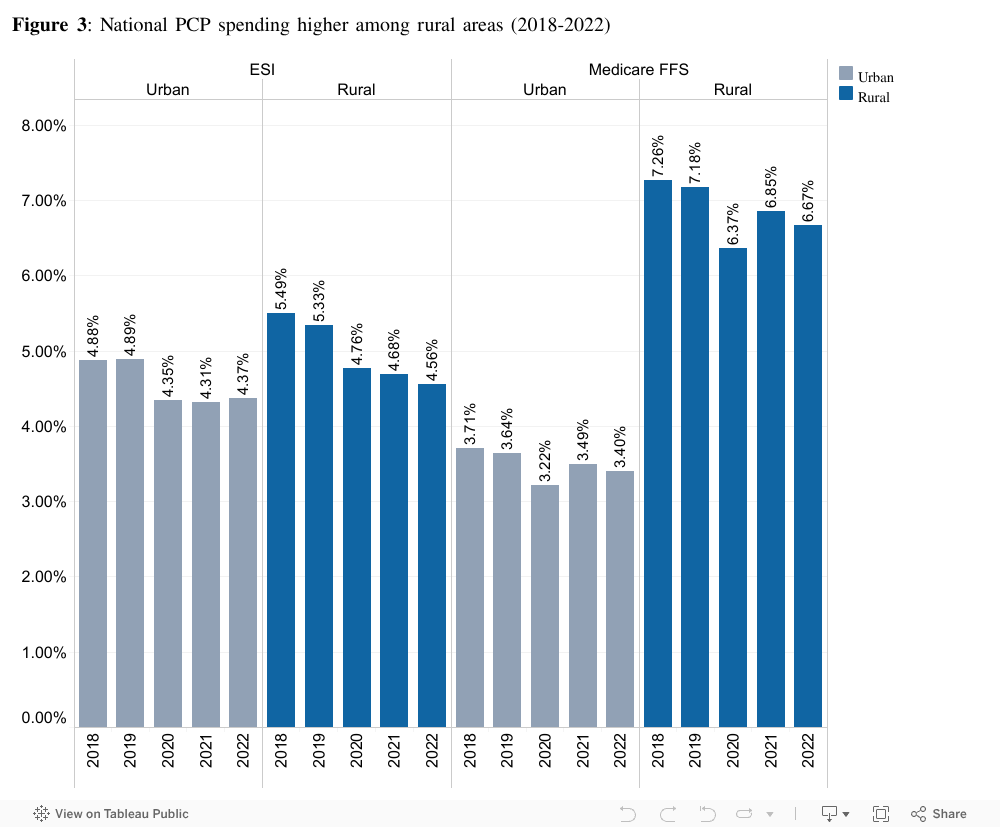
The higher share of spending in rural areas was present in each year between 2018 and 2022 for both ESI and Medicare (Figure 3). Consistent with the national trends, we found that primary care spending in rural and urban areas has decreased over time. For example, in rural areas, the share of primary care spending among ESI enrollees decreased by 17% over five years while the share among Medicare FFS enrollees decreased by approximately 8% over the same period. In urban areas, the share of primary care spending among people with ESI decreased by 8.37% while the share among people with Medicare FFS decreased by nearly 8.58% from 2018 to 2022. See the downloadable data for rural-urban analysis by state.
As noted in the state analysis, variation in the share of spending could be due to differences in the amount spent on primary care services, the cost of health care services overall, or a combination of both, so these results should be interpreted carefully.
Declining shares of primary care spending in ESI and Medicare highlight the need for strategic investment
In this analysis, we found that shares of total medical and prescription spending on services rendered by PCPs between 2018 and 2022 were consistently lower than other OECD countries. During this same period, we found that the shares of PCP spending have decreased at both national and state levels. We also observed that shares of PCP spending were higher among rural areas compared to urban areas, particularly among the Medicare FFS population.
There are several factors that may contribute to a higher proportion of PCP spending in the ESI population relative to the Medicare FFS population, such as higher ESI reimbursement amounts or higher use of specialists among people with Medicare FFS. Higher shares of PCP spending in rural areas, compared to urban areas, may be attributable, in part, to differences in where primary care providers practice. A study found that physician specialists were more likely to practice in urban areas, while physicians with primary care specialty such as family medicine were more likely to practice in rural areas.
As of 2025, there are over one thousand counties in the US designated as primary care shortage areas (PCSAs) by the Health Resources and Services Administration. PCSAs are associated with longer wait times to schedule appointments with a PCP. Longer wait times for appointments with a PCP can lead to challenges in accessing care, especially as PCPs are often the first point of contact for a patient to receive referrals to specialists.
As policymakers pursue investments in primary care, studies have found that areas with higher PCP supply were associated with better population health outcomes. Declining proportions of primary care spending in both the ESI and Medicare FFS populations highlight the need for a robust national and state strategy on increasing primary care investment and provider supply.
[1] Starfield, Barbara. Primary Care: Concept, Evaluation, and Policy. Oxford University Press, 1992.
Acknowledgements
We would like to extend our appreciation to the Robert Graham Center for their contributions to this project. Their expertise, insights, collaboration, and passion greatly enhanced the quality and depth of this project.
Methods
For this analysis, we used HCCI’s commercial claims and Medicare FFS claims between years 2018 and 2022. We limited our sample to enrollees with ESI and Medicare FFS (Parts A+B). We excluded claims where the health plan was not the primary payer and where the allowed amount was less than or equal to $0. The denominator is defined as the sum of allowed amounts among all facility, physician, and prescription claims of the eligible enrollees. We weighted spending and utilization using ESI weights to develop estimates representative of the national ESI population younger than 65. ESI weights were calculated using the American Community Survey (ACS) 2021 5-year estimates Public Use Microdata Sample (PUMAS).
Narrow and broad definitions were used to define PCPs. In the narrow definition, PCPs include family medicine, general practice, geriatrics, internal medicine, pediatrics, and osteopathy, excluding physicians with specialization that are not PCP (for example, oncology). In the broad definition, PCPs include all the previously mentioned descriptions, as well as obstetricians/gynecologists, psychiatrists, psychologists, nurses, nurse practitioners, physician assistants, counselors, nurse practitioners and registered nurse school providers, and social workers. Additionally, our analysis was restricted to services that were rendered in an ambulatory setting, defined as either in physician’s office or hospital outpatient departments. Services such as evaluation visits rendered by an internalist during the course of a hospitalization were excluded from our numerator.
Note: Several states were excluded from different levels of analysis. Alabama (AL), Hawaii (HI), North Dakota (ND), Montana (MT), Wyoming (WY), and New Mexico (NM) were excluded from the state-level analysis due to small samples. These same states, along with Washington D.C., Rhode Island (RI), New Jersey (NJ), Florida (FL), Connecticut (CT), Massachusetts (MA), and Maryland (MD), were excluded from the state-rural level analysis due to having fewer than 15% rural zip codes. Medicare FFS will report data for all states but will exclude the previous states from the state-rural level analysis.