
Neonatal Intensive Care Units (NICUs) provide critical, often life-saving, care to over 300,000 infants every year. The specialized care and technology available in NICUs have allowed preterm and otherwise vulnerable babies to survive and thrive even in the face of a host of potentially life-threatening complications and are recognized as contributing to the decline in infant mortality over the past 50 years. For many families, this advanced and often highly complex care can pose a significant financial burden along with the emotional toll of having a newborn in the hospital.
In this brief, we examine trends in NICU use and spending from 2017-2021 among people with employer-sponsored insurance using HCCI’s database of commercial claims data. In 2021, 18% of newborn admissions involved some NICU care, an 8% increase since 2017. On average, spending for a NICU admission was $71,158 in 2021, but there was a wide range from $4,488 (10th percentile) to $161,929 (90th percentile). The average number of days for a NICU admission was 14 days, but again there was substantial variation in length of stay from 3 days (10th percentile) to 34 days (90th percentile).
The wide range in spending and length of stay among NICU admissions reflects the range of services provided and complexity of patients in NICUs. The American Academy of Pediatrics defines four levels of newborn care based on babies’ health status, birthweight, and prematurity.
- Level I care is care provided in nurseries to low-risk babies
- Level II care is for “stable or moderately ill” newborns who are born at ≥32 weeks’ gestation or who weigh ≥1500 g at birth (or who are under these thresholds prior to transfer to a higher level facility)
- Level III care is for infants who are born at <32 weeks' gestation, weigh <1500 g at birth, or with medical or surgical conditions
- Level IV facilities provide care for the “most complex and critically ill newborn infants,” including availability of a full range of pediatric medical and surgical specialists.
Levels of care II, III, and IV are considered to be NICU care.
In 2021, More Newborns were Admitted to the NICU and Spending per NICU Admission was Higher than in 2017
More than 80% of newborns in our data received only general newborn/nursery care (Level I plus other nursery care) in each year from 2017 through 2021. The share of newborn babies receiving any NICU care (Levels II-IV) rose slightly from 2017 (17.0% of newborns) to 2021 (18.3%).
Our analysis of admissions and spending by NICU Level is complicated by the fact that over one-third (36%) of newborns receiving NICU care in the HCCI data received multiple levels of NICU services during the same admission (e.g., a baby may have started in NICU Level III and then moved to NICU Level II after a day or several days). To identify NICU admissions and associated spending by level, we classified each newborn admission by the highest level of care the baby received during that admission. For example, if a baby had claims for both Level II and Level III NICU care during the same admission, we assigned this admission to Level III.
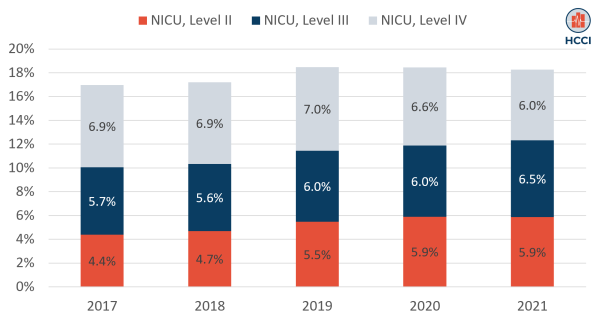
Using this approach, we found that the share of newborns receiving Level II care increased from 4.4% in 2017 to just under 6% in 2021 and the share receiving Level III care increased from 5.7% to 6.5% (Figure 1). The share of newborns receiving Level IV care decreased slightly from 6.9% to 6.0%.
Figure 1. Share of Newborns Receiving NICU Care, by Highest Level of Care (2017-2021)
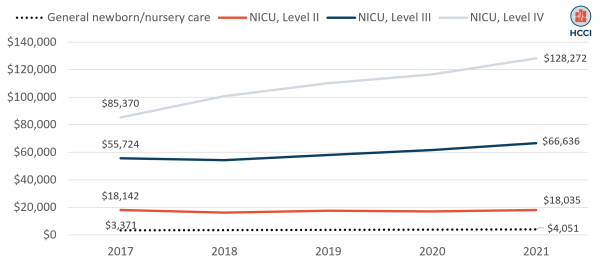
The average spending per newborn admission in 2021, assigning the highest level of care during the admission, ranged from just over $4,000 for general newborn/nursery care to over $128,000 for an admission with Level IV care (Figure 2). Between 2017 and 2021, spending per admission increased for Level III and Level IV admissions while spending per Level II admission was stable over that period.
Figure 2. Average Spending per Newborn Admission by the Highest Level of Care (2017-2021)
Admission-Level Spending Increases were Driven by Rising Per-Day Spending
Rising spending per admission could be driven by higher average spending per day, more days in the hospital for the average admission, or a combination. To better understand these factors, we looked at average daily spending and length of stay for each individual level of care. In this approach, if a newborn admission included a Level II NICU stay and a Level III NICU stay, we calculated the daily spending and length of stay separately for each level.
In the prior section, our spending measure includes both the facility component of the admission spending (i.e., charged by the hospital) and the professional component (i.e., for the physician and other clinician services provided during the admission). Here, our daily spending measure focuses on the facility component of the bill; facility spending accounts for the majority of total spending and can be most cleanly attributed to days within an admission to calculate daily spending by level of care.
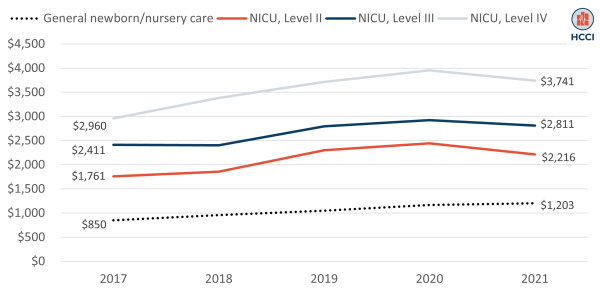
As expected, average daily facility spending rose with level of care, from $1,203 for general newborn/nursery care in 2021 to $3,741 for Level IV care (Figure 3). Average daily spending increased between 2017 and 2021 for all levels of care. The largest increase in average daily spending was for a day of general newborn/nursery care, which rose 42% from $850 in 2017 to $1,203 in 2021. Average daily spending rose 26% for NICU Level II and IV admissions and 17% for NICU Levels III admissions.
Figure 3. Average Daily Inpatient Spending for Newborn Care Admissions by Level of Care (2017-2021)
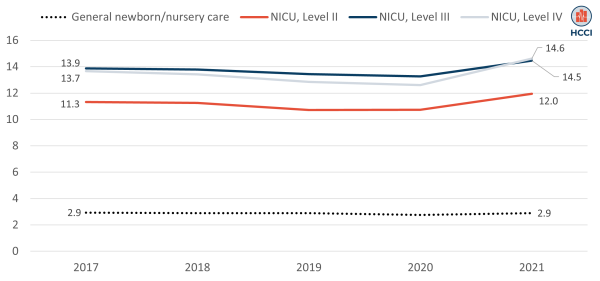
In contrast to rising average daily spending, the average number of days associated with newborn admissions did not change substantially over the 2017-2021 period (Figure 4). In 2021, length of stay ranged from 2.9 days, on average, for a general newborn/nursery stay to close to 15 days for a Level IV NICU stay. The largest change in average length of stay over the 2017-21 period was for the most complex NICU admissions (Level IV), which rose from 13.7 days, on average, in 2017 to 14.6 days on average in 2021 (7%). The smallest change was for well-baby/general nursery stays, which remained stable over this period.
Together, these results suggest that increases in per-day spending contributed more to rising admission-level spending than an increase in the number of days in an average admission. Increases in daily spending could reflect changes in services provided (e.g., more complex/resource intensive) and/or increases in unit prices.
Figure 4. Length of Inpatient Stay per Newborn Care Admission by Level of Care (2017-2021)
Concerns About Over- and Underuse of NICU Care, as well as High Costs, Call for Ongoing Monitoring
NICUs are often cited as an example of a major, life-saving advance in health care and technology over the last several decades. Many babies who would not have survived preterm birth, low birthweight, and other newborn complications now survive and thrive due to the advanced care they receive in NICUs across the country. At the same time, there are concerns about potential overuse of these services in cases where this high level of care may be unnecessary, and even risky, and underuse in situations where it could be valuable. Our, and other, data also suggest that the costs of a NICU admission are high and growing, leaving families to face potentially high bills for newborn care at the same time as they are paying high out-of-pocket expenses for their recent childbirth. Going forward, ongoing monitoring of use of and spending on NICU care will be important to ensure that all families can access these services in an appropriate and affordable way.
Methodology
We identified newborn inpatient admissions using the diagnostic-related groups (DRGs) below and defined each admission based on the unique combination of individual identifier admission and discharge dates.
- DRG 789 Neonates, Died or Transferred to Another Acute Care Facility
- DRG 790 Extreme Immaturity or Respiratory Distress Syndrome, Neonate
- DRG 791 Prematurity with Major Problems
- DRG 792 Prematurity without Major Problems
- DRG 793 Full-Term Neonate with Major Problems
- DRG 794 Neonate with Other Significant Problems
- DRG 795 Normal Newborn
We defined newborn levels of care based on definitions from the American Academy of Pediatrics, and assigned admissions (or days during an admission) to a level of care using revenue codes. Revenue codes 0170 and 0171 were used to identify Level I newborn care, revenue code 0172 was used for defining Level II newborn care, revenue code 0173 was used for Level III newborn care, and revenue code 0174 was used for Level IV newborn care. See Centers for Medicare & Medicaid Services Regulations and Guidance, Transmittals documentation for details of revenue codes’ description.
Average spending per admission was calculated by dividing the total expenditures for all newborn admissions in the data (defined as sum of payer paid and patient out-of-pocket amounts) by the total number of newborn admissions between 2017 and 2021. To provide a more complete picture of health care spending associated with newborn admissions, we combined all facility and professional claims associated with each inpatient admission.
Daily spending on was calculated at the individual identifier-service date-revenue code level (e.g., for a day of Level III [revenue code 0173] care). Daily spending was based on facility claims only since these can be most cleanly linked with a day of service. We calculated daily spending by dividing total expenditures per revenue code by the total number of service days within an inpatient admission. Similarly, the average length of stay is defined by the average of number of service days per revenue code.