Cancer diagnoses can have devastating psychological and financial tolls on patients and their families. Previous research shows that Medicare beneficiaries who are newly diagnosed with cancer experience health care costs that can reach close to a quarter of household income in the year following diagnosis. People with employer-sponsored insurance (ESI) may experience even greater financial burden given that they pay higher prices than Medicare enrollees for many health care services, though this may be offset by more generous benefit design (e.g., an out-of-pocket maximum).
In this brief, we examined total and out-of-pocket spending among ESI enrollees in HCCI’s claims database who were newly diagnosed with cancer between 2013 and 2018. We examined how much people with new cancer diagnoses paid out-of-pocket in the year leading up to and following their cancer diagnosis. We also assessed how spending was distributed in the year following diagnosis and the services on which people spent most in this period.
Total Medical Spending Grew Over 220% in the First Quarter Following a Cancer Diagnosis
To examine how spending changed following a cancer diagnosis for enrollees in our data, we calculated spending per person in the four quarters prior to diagnosis and the four quarters following diagnosis. We estimated total medical spending and out-of-pocket spending for each person in each quarter, controlling for patient demographics including their pre-diagnosis health status (i.e., comorbidities) and time relative to diagnosis.
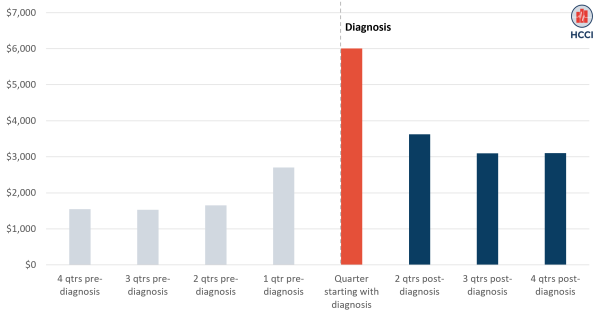
As shown in Figure 1, average total medical spending increased in the quarter leading up to the cancer diagnosis (“1 qtr pre-diagnosis”), peaked in the quarter including and following diagnosis and then declined, though post-diagnosis spending remained higher than pre-diagnosis spending throughout the year.
Specifically, average quarterly spending was $1,578 in the second, third, and fourth quarters prior to diagnosis. Average spending then increased to $2,706 in the quarter immediately preceding diagnosis (a 71% increase over the earlier quarters) likely due to procedures, tests, and acute medical events that resulted in the diagnosis. Most post-diagnosis spending was concentrated in the quarter immediately following the diagnosis (red bar), which includes the day of diagnosis. In this quarter, average spending was just over $6,000, more than 280% higher than the average quarterly spending before diagnosis, excluding the quarter just before the diagnosis. The average quarterly spending was $3,277 in the second, third, and fourth quarters following diagnosis (a 108% increase compared to quarters before diagnosis).
Figure 1. Total Spending Rose Over 200% Following Cancer Diagnosis

ESI Enrollees Spent Close to $700, on Average, in the Quarter Following a Cancer Diagnosis
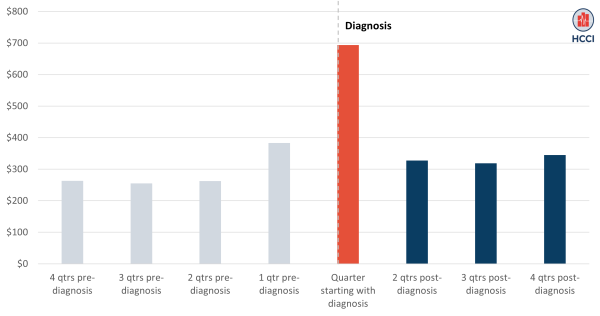
On average, enrollees spent $693 out-of-pocket in the first quarter following a cancer diagnosis, as shown in Figure 2 (red bar); this was over twice as high as average quarterly spending in the four quarters pre-diagnosis ($291). Following a cancer diagnosis, out-of-pocket spending grew especially for administered drugs (117% higher in the quarter of diagnosis compared to pre-diagnosis), procedures (73% increase), and lab services (14% increase), as shown in the Downloadable Data accompanying this brief.
As with total spending, out-of-pocket spending declined following the quarter of diagnosis, though it remained higher than prior to diagnosis. In the second, third, and fourth quarters following diagnosis (blue bars), average out-of-pocket spending was $330, compared to an average of $260 in quarterly spending pre-diagnosis, excluding the quarter just before the diagnosis when there was an increase in spending. At least in part, drops in out-of-pocket spending following the initial spike in the quarter of diagnosis may reflect benefit design (e.g., reaching the deductible or even out-of-pocket maximum) protecting patients from catastrophic out-of-pocket expenses.
Figure 2. Average Out-of-Pocket Rose to Nearly $700 Following a Cancer Diagnosis

ESI Enrollees Newly Diagnosed with Cancer Experienced an Immediate Increase in Spending
An unanticipated spike in out-of-pocket spending, especially within a short period as we see following a cancer diagnosis, may force difficult choices between health care and other necessities (e.g., housing, food) and lead to unpaid medical bills and medical debt. Financial strain may be especially devastating for lower-income families, who are less likely to have disposable income to weather financial shocks.
The financial burdens of cancer treatment and management extend beyond what we can capture in claims data, including loss of wages and family caregiving resources. Importantly, our ability to track individuals’ health care spending and use in the HCCI data for the year following a cancer diagnosis depends on their ability to keep working and thereby maintain their insurance coverage (unless they are a dependent on a family member’s plan). Therefore, the spending and use data shown here may be less representative of individuals who lose their jobs due to a new diagnosis. Claims data, however, do provide a window into the timing and substantial magnitude of the financial burden of a cancer diagnosis, even among those with health insurance.
Methods
Analytic dataset identification
- Our analytic samples contain 1.95 million ESI enrollees with evidence of an incident cancer diagnosis between 2013 and 2018. To ensure complete study identification and washout period, we specifically excluded incident diagnosis in the years 2012, 2019, and 2020. We excluded 2020 from our sample due to the pandemic and potential pandemic-induced drop in health care use.
- For evidence of incident cancer diagnoses, enrollees were required to have at least two claims with cancer diagnosis code (any position) with service dates separated by at least 7 days. We set the first qualifying service date as our index dates.
- We then required enrollees to be continuously enrolled with medical and pharmaceutical coverage one year pre- and post- index date.
- We excluded enrollees with evidence of cancer in the 365 days prior to index date.
- We excluded enrollees with multiple demographic (sex, age band code, and zip code) values (< 1% of total sample).
Statistical methods
- We adjusted total quarterly medical and out-of-pocket amounts using a generalized linear regression model that controls patient demographics, baseline comorbidity index, and time fixed effects.
Main outcomes:
- Adjusted total quarterly medical amounts (defined as sum of health plan paid amounts and out-of-pocket amounts).
- Adjusted quarterly out-of-pocket amounts
- Financial burden defined as ratio of quarterly adjusted out-of-pocket spending to quarterly income
- Annual income derived from 2019 ACS 5-year estimates linked to enrollee’s zip code of residence at time of diagnosis. Quarterly income was derived using annual income divided by 4.
Limitations
- Our study has a few limitations owing to the retrospective nature of administrative claims data. First, our incident cancer diagnosis date, derived from claims and not from prospective or medical records, may be misclassified and therefore we may be undercounting out-of-pocket amounts if actual cancer diagnosis was earlier. Our dataset does not contain key clinical information such as cancer stage at diagnosis, which greatly influence the intensity of treatment regimen and therefore health care spending. Continuous enrollment requirement for our analytical sample can introduce survivor bias as we require enrollees to be enrolled at least a year after diagnosis. Therefore, our study does not include end-of-life spending. Our study contains direct medical expenses as observed in administrative claims data, our data does not contain data on indirect expenses such as informal caregiving or medical leaves (e.g., loss wages).
- Our out-of-pocket financial burden measure may be imprecise. Income used in our financial burden measure is a proxy for income based on the zip code of enrollee’s residence. Our measure does not consider disposable income, that is income net of living expenses such as utility bills, mortgage or rents, etc. Previous research has shown that people residing in poorer areas tend to live paycheck-to-paycheck and have less disposable income.
