
Blood cancers represent a range of diseases that can affect blood cells, bone marrow, lymph nodes, and other parts of the lymphatic system. Health care claims data can provide insights into how many people are dealing with blood cancers.
Using claims data from people enrolled in Medicaid, employer-sponsored insurance (ESI), and Traditional Medicare, this data brief highlights the percentage of people with a blood cancer diagnosis across types of insurance coverage. The brief also examines rates of diagnosis by age group, type of blood cancer, and state. Blood cancers are categorized into leukemia, lymphoma, myeloma, myelodysplastic syndromes (MDS), and myeloproliferative neoplasms (MPNs).
As described in more detail below, we find that Traditional Medicare had the highest rate of blood cancer diagnoses among its population both nationally and across states, and diagnosis rates primarily increase with age across the population. This analysis also finds that lymphoma is the most common type of blood cancer among people enrolled in ESI and Medicare, and leukemia makes up most of the blood cancer diagnoses among people with Medicaid.
Rate of Blood Cancer Diagnosis in Traditional Medicare is 8.5 times than in ESI. ESI rate is nearly double the Medicaid rate.
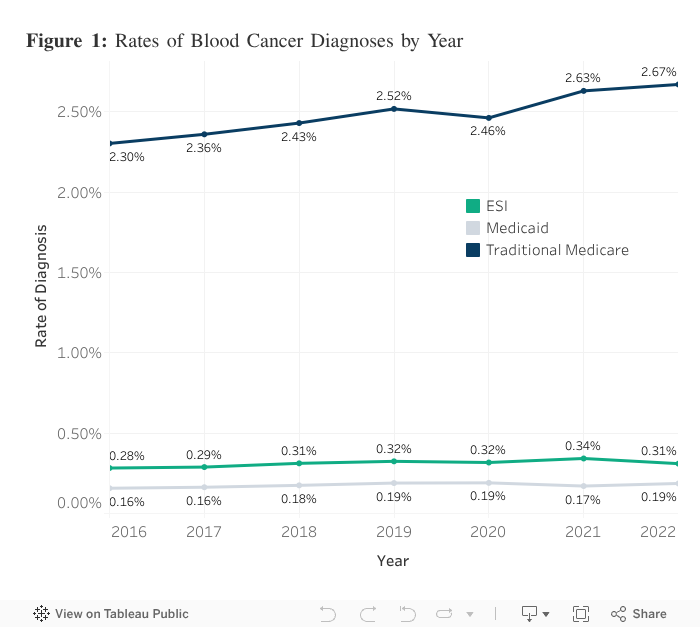
In 2022, 2.68% of people enrolled in fee-for-service Medicare (Traditional Medicare) had a blood cancer diagnosis. In the same year, the rate of diagnosis among enrollees with ESI was 0.31% and 0.19% among Medicaid enrollees. The substantially higher rate of blood cancer diagnosis among the Traditional Medicare population is likely related to eligibility rules (i.e., some blood cancer diagnoses qualify people for disability that can then qualify them for Medicare benefits). Additionally, across payer types, the rate of blood cancer diagnoses among adults increases with age. Because Medicare predominantly provides coverage to people above the age of 65, higher rates may be expected.
As shown in Figure 1, rates of blood cancer diagnosis have been relatively stable from 2016-2022. The largest growth has been among the Traditional Medicare population. The 2.67% rate in 2022 is 0.37 percentage points higher than the rate in 2016, but that represents a 16% increase over the time period.
Among Adults, Rates of Blood Cancer Diagnoses Increase with Age.
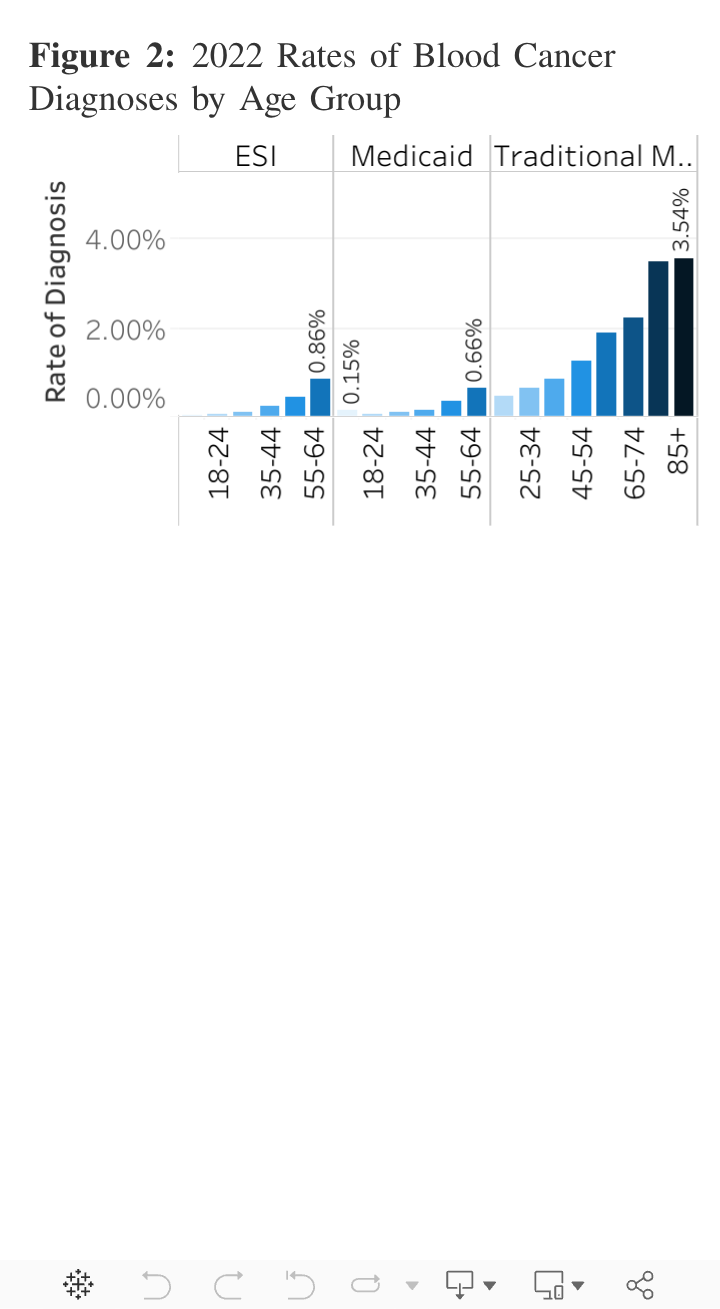
Across Medicaid, ESI, and Traditional Medicare, rates of blood cancers among adults increase along with age category, as shown in Figure 2. For example, among people enrolled in Medicaid, those aged 55-64 had a blood cancer diagnosis rate of 0.66% compared to 0.36% for people aged 45-54 and 0.08% for those aged 18-24. The rate of diagnosis among Medicaid enrollees 55-64 was 1.8 times the rate of 45-54 years old and more than 8 times the rate of Medicaid enrollees between the ages of 18 and 24.
Similar patterns exist among ESI enrollees, with 0.86% of people ages 55-64 enrolled in ESI having a blood cancer diagnosis, which is twice the rate of adults 45-54 (0.43%) and 9.5 times adults ages 18-24 (0.09%).
Rates of blood cancer diagnosis also increase among adults enrolled in Medicare. Among enrollees aged 65 and older, rates of blood cancer diagnosis increase by age band with a sharp uptick among people aged 75-84. Slightly more than 3.5% of Medicare enrollees age 85 and above had a blood cancer diagnosis, a rate similar to those ages 75-84 (3.47%). Both are more than 1.5 times higher than the rate among Traditional Medicare beneficiaries aged 65-74.
Figure 2 also demonstrates that diagnosis patterns among insurance types hold across age bands. Across each age category, Traditional Medicare enrollees were diagnosed with blood cancer at higher rates than people with Medicaid or ESI for each overlapping age band. For example, 0.47% of Medicare beneficiaries ages 18-24 had a blood cancer diagnosis compared to 0.09% of ESI enrollees and 0.08% of people enrolled in Medicaid. Similarly, 1.26% of Traditional Medicare beneficiaries ages 45-54 had a blood cancer diagnosis compared to 0.43% of ESI enrollees and 0.36% of Medicaid enrollees of the same age.
Rates of Blood Cancer Diagnosis Among Children are Higher in Medicaid than in ESI.
This analysis finds that 0.15% of children ages 0-17 enrolled in Medicaid had a blood cancer diagnosis in 2022. That is 2.5 times the rate of children with employer-sponsored insurance. This higher rate is likely related to Medicaid eligibility rules (in some states, Medicaid provides wrap around coverage for low and middle-income families of children with special health care needs including cancer). It also is nearly twice the rate among young adults (18-24 year-olds) enrolled in Medicaid.1
Leukemia and lymphoma were the most common blood cancer diagnoses.
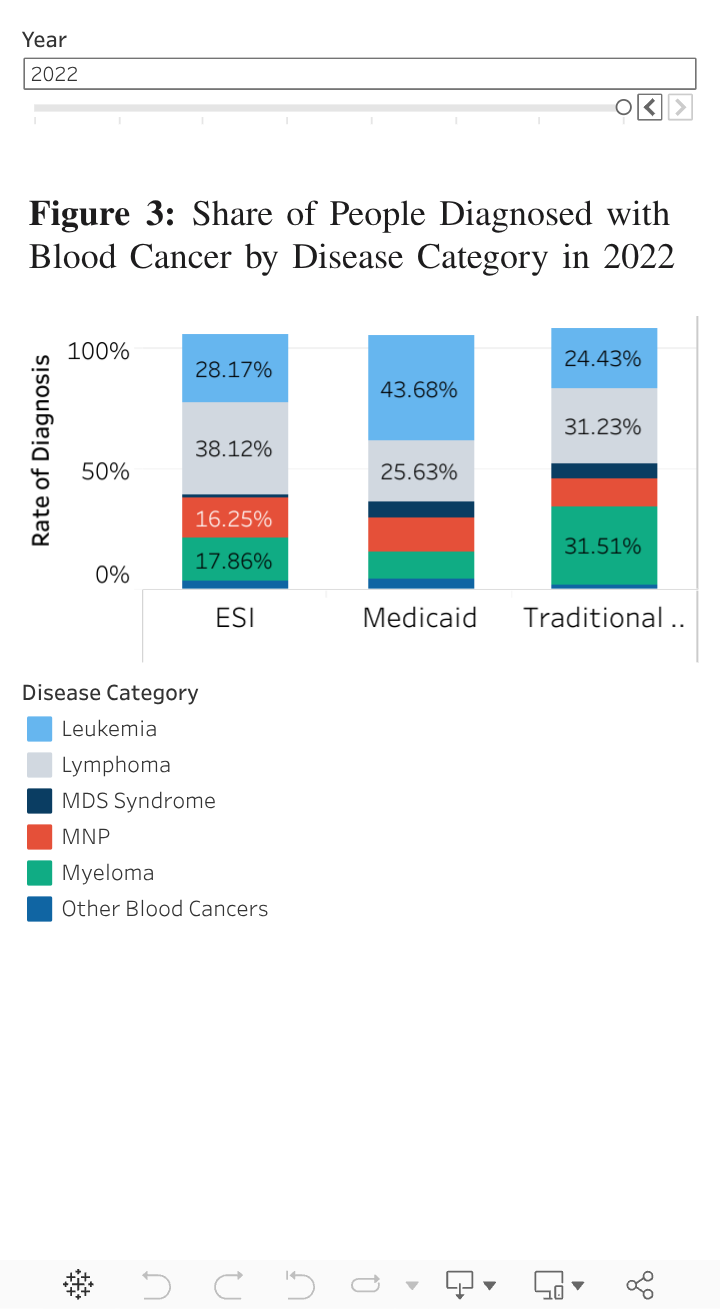
Figure 3 illustrates the breakdown of types of blood cancer among people with any blood cancer diagnosis by type of insurance. 12% of patients in 2022 were diagnosed with more than one type of blood cancer. Lymphoma and leukemia combined make up the majority of blood cancer diagnoses in Medicaid, ESI, and Traditional Medicare. Among each payer population, however, a different blood cancer made up the plurality of diagnoses. Lymphoma was the most common diagnosis among people with ESI. Leukemia was the most common among people enrolled in Medicaid, and myeloma was the most common among Traditional Medicare beneficiaries.
Specifically, in 2022, lymphoma accounted for 38% of ESI cases, 31% of Traditional Medicare cases, and 26% of Medicaid cases. Leukemia, the most common cancer among children and adolescents, accounted for 44% of Medicaid cases, 28% of all blood cancer cases among ESI enrollees, and 24% of Medicare cases in the same year. Myelomas made up more than 30% of blood cancer cases in Medicare but less than 20% in ESI and Medicaid.
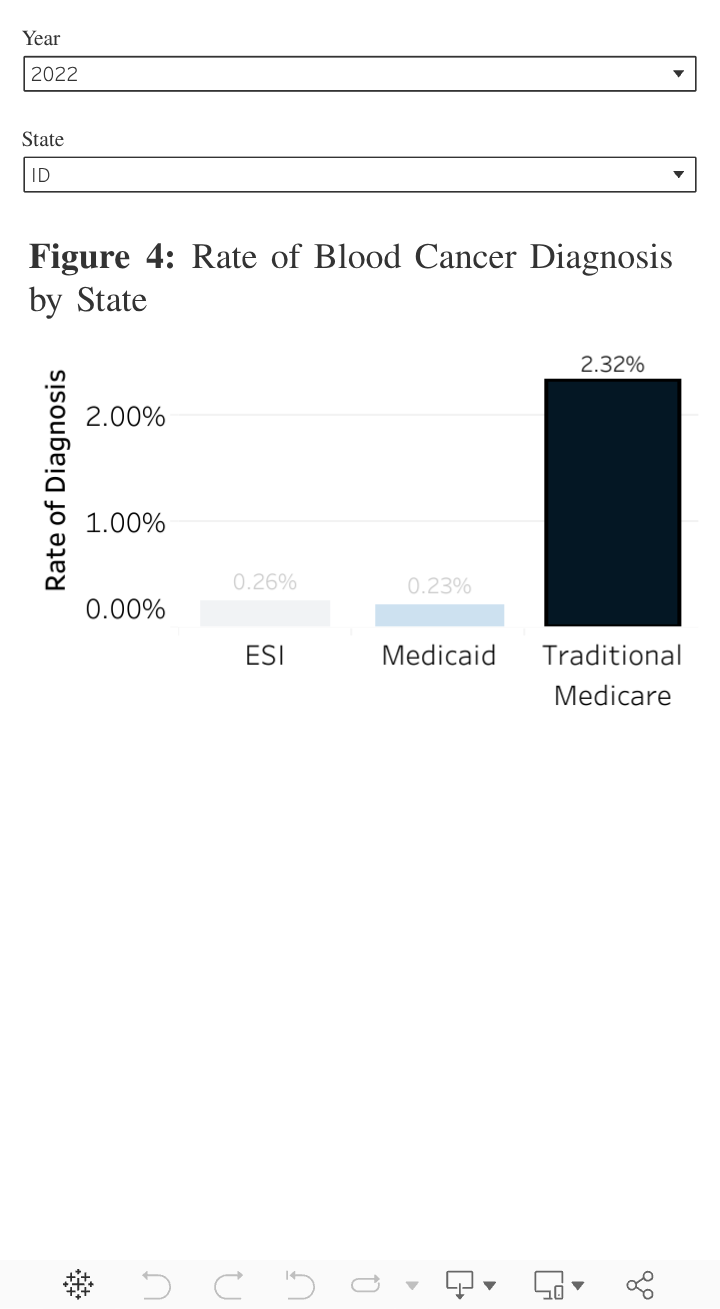
Rates of blood cancers within states are similar to national trends.
By state, rates of blood cancer diagnoses trend similarly to the national rates we observe. Across states, Medicare rates are the highest, while Medicaid rates are the lowest, as seen in Figure 4. Rates of blood cancer diagnoses among ESI enrollees range from 0.18% in Wyoming to 0.4% in Florida. Rates span from 0.11% of Medicaid beneficiaries in Tennessee to 0.29% in New York, and Medicare rates vary from 1.69% in Arkansas to 3.72% in Connecticut.
Gaps in Blood Cancer Diagnosis Rate Between ESI and Medicaid is Greater Among Children and Young Adults (0-34) than other adults (35-64).
As seen in Figure 5 2, we compare the rates of blood cancer in children and young adults to the adult population3. We examined the rates of blood cancer between ESI enrollees and Medicaid beneficiaries in these under -65 age groups in each state. As previously mentioned, Medicare is available for certain people with disabilities who are under age 65 but primarily covers older Americans so was not included in this analysis.
Across states, there is a wider difference in blood cancer diagnosis rates between the Medicaid and ESI populations among people between the ages of 0-34. In contrast, rates of diagnosis are more similar among the 35-64 populations. In 2022, for example, 0.10% of the ESI population in Idaho ages 0-34 were diagnosed with blood cancer in 2022 compared to 0.46% of Idaho Medicaid beneficiaries. Among people ages 35-64, in contrast, rates of diagnosis were similar in Medicaid (0.59%) and ESI (0.59%) in 2022.

[1] Note, around 2.5% of Medicare FFS beneficiaries ages 0-18 had a claim with a blood cancer diagnosis. Because of the small sample size, we removed them from this analysis.
[2] Some states may be missing rates for a specific age group if the sample size did not meet our threshold.
[3] The National Cancer Institute defines children as ages 0-14 and young adults as ages 15-39. HCCI’s claims data only allows for grouping ages 0-34, so we do not completely capture the AYA population.
Methodology:
Our cohorts includes beneficiaries who were continuously enrolled in their respective plan for each calendar year. For these cohorts, we pulled all inpatient, outpatient, and physician claims to look for claims with at least one inpatient claim or two outpatient or professional claims with a blood cancer diagnosis in any diagnostic position. To calculate the national rates of diagnosis, we counted all unique enrollees diagnosed with at least one blood cancer diagnosis as defined above. The blood cancer category rates of diagnosis were calculated by counting each unique enrollee diagnosed with each blood cancer category divided by the total number of enrollees diagnosed with at least one blood cancer. Some enrollees can fall into multiple blood cancer categories if they have multiple types of blood cancer.