
The Centers for Disease Control and Prevention (CDC) reports that there were more than 45,000 firearm-related deaths in 2020; in addition, evidence suggests that there were an additional 2-3 nonfatal firearm injuries seen per death. Recent studies estimate that more than 200 people are injured by firearms each day, and the notable tragedies in 2022, along with the daily toll of firearm-related injury, spurred Congressional action for the first time in decades.
Firearm-related injury has decimated families, communities, and an entire nation. The impact has also placed a significant emotional and mental burden on health care workers, and an economic burden on health care systems having to care for injured patients (see, for example, citations listed below). To understand that impact across a broader share of the population with health insurance through an employer than has been studied before, we looked at the Health Care Cost Institute’s (HCCI) unique commercial claims dataset, which covers over one-third of people who get health insurance through their jobs.
The purpose of this study was to determine how many people in this population received health care services related to a firearm injury between 2016 and 2020, how much was spent on firearm-related injuries among this population over this period, and what per-person spending looked like pre- and post-injury. We found that the number of health services with a firearm-related injury diagnosis code and total spending on these services increased between 2016 and 2020.
We also observed consistently higher spending among patients with a firearm injury in the year following that injury than in the year before the injury. Total spending per person increased from a mean of $5,691 in the year prior to the firearm injury to a mean of $12,866 in the year after the firearm injury (excluding acute care costs on the days immediately around the injury). When we include the acute care costs, average per-person spending after an injury was 6 times higher than spending in the prior year.
This analysis is limited to people with employer-sponsored insurance (ESI) who had a health care service that generated a claim. Therefore, it does not capture the total cost to the health care system resulting from firearm-related injuries. For example, people who lost their lives from the injury without receiving health care services related to their injury are not included here, people who get health insurance from another source or are uninsured are not included here, and the impact on family members is not included here. It is important to acknowledge that studying the ESI population is likely to exclude those who are disproportionately affected by gun violence.
Nevertheless, nearly half the US population gets health insurance through work, so trends among this population are important inputs to a growing understanding of the impact of firearm injuries on the U.S. health care system.
Health Care Use and Spending Associated with Firearm Injuries Among People with Employer-Sponsored Insurance Increased from 2016-2020
To quantify health care use related to firearm injuries, we measured the number of times that firearm injury-related health care visits occurred over the five-year study period (2016-2020). We identified claims affiliated with firearm injuries as any claim line with a firearm-related ICD-10 diagnosis code across all health care settings and types of services. As shown in Figure 1, over this time period, the use of health services with a diagnosis code related to firearm injuries increased by more than 30%, from 61.9 per 100,000 enrollees in 2016, to 81.7 per 100,000 enrollees in 2020, with the greatest increase (20%) from 2019 to 2020.

We then examined trends in health service spending (calculated as the total allowed amount associated with firearm-related injury claims as defined above) among enrollees over the same time period. Spending on firearm injuries per 100,000 people in our population was just over $35,000 in 2016 and grew to more than $51,500 by 2020 (Figure 2). Thus, spending per 100,000 ESI enrollees on firearm-related injuries increased 49% from 2016 to 2020, a faster pace than the 32% increase in health care use related to firearm injuries shown in Figure 1.
As with trends in firearm-related injury claims, the largest year-over-year growth in spending (13%) occurred from 2019 to 2020. The faster growth in spending relative to use suggests that more is being spent per firearm-related injury service over time; this pattern could be due to higher prices, more severe injuries, emergency room upcoding, or some combination of these factors.

Spending in the 12 Months After a Firearm Injury Far Exceeded Spending in the 12 Months Before the Injury
To understand how much spending was associated with firearm injuries on a per-person basis, both at the time of and following the injury, we constructed a cohort of individuals with an initial firearm injury between 2017 and 2019, using methods similar to Ranney et al., 2020. To be included in the cohort, an individual must have been continuously enrolled in their health plan for the year preceding and the year following the date of the first firearm injury diagnosis we observe in our data.
Among this cohort, per-person spending in the 12 months before the injury was just over $5,691, comparable to per-person spending among people with employer-sponsored insurance more generally. Specifically, HCCI’s 2020 Health Care Cost and Utilization Report estimates per-person spending among people with ESI was just over $5,600 in 2020.
In the year following their firearm-related injury, per-person spending increased dramatically. Excluding the period immediately around the main firearm-related injury diagnosis (defined as the 14 days before and after the identified firearm injury-related claim), per-person spending in the year post-injury was nearly $13,000, more than 120% higher than the year before their injury. Including the period immediately around the acute injury care, per-person spending post-injury was, on average, $37,116, more than 550% higher than pre-injury spending (Figure 3). Nearly $25,000 per person (about 65% of total post-injury spending) was attributed to the immediate acute care period of the firearm injury (i.e., including the claim with the firearm injury-related code and spending 14 days before and after that claim).

High spending following a firearm-related injury persisted over the course of the full year after the injury. We observed this by comparing spending post injury at the monthly level to average spending in the analogous month prior to the injury. This comparison allowed us to examine whether post-injury spending was persistently higher across all months in the 12 months following the injury or if higher spending was concentrated within a subset of months (Figure 4). For this analysis, we excluded spending 45 days before and after the date on which the injury was first observed.
Spending in each month following the firearm-related injury was nearly double spending in the corresponding month before the injury. In some cases, the spending was much more than double. For example, spending in the fifth month following the injury was $1,124, compared to $409 in the month five months prior to the injury. This suggests that the spending impact of the firearm injury continued well beyond the period immediately around the original injury.

In the Year Following the Injury, Enteral and Parenteral Services and Wheelchairs Saw the Highest Growth in Spending
Certain categories of spending had especially large increases following the firearm injury (relative to before the injury) among our cohort. For example, as shown in Figure 5, per-person spending on enteral and parenteral services (i.e., nutrition support services) among the cohort was 26 times higher following injury than before. Additionally, wheelchairs; physical, occupational, and speech therapy services; home services; and eye procedures saw the most dramatic growth from the 12 months pre-injury to the 12 months post-injury.

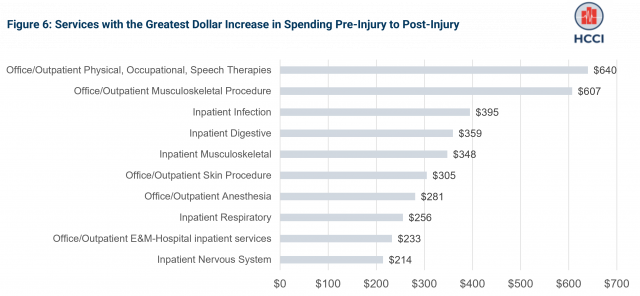
In addition to evaluating above which services had the highest percentage growth in spending, we evaluated how per-person spending changed in dollar terms (Figure 6). The greatest increase in per-person spending from the pre-injury period to the post-injury period was on physical therapy, occupational therapy, and speech therapy services. Per-person spending in the 12 months preceding the injury was about $76 on average; post injury, it was nearly $716. Musculoskeletal procedures and admissions as well as hospital infection admissions and hospital digestive admissions were also among the five services for which spending increased the most in absolute terms after the injury.
Claims Data Allow for Insights into Firearm Injury-Related Health Care Services; Additional Analyses are Needed to Understand the Full Impact of these Injuries
This analysis shows that, among people who get health insurance through an employer, the number of encounters with firearm-related injuries increased from 2016 to 2020 and that spending associated with those injuries increased over the same period. It also demonstrates that higher spending persisted for at least 12 months post-injury and highlights the services where we observe the greatest increases in spending.
Although this data brief looks only at a subset of people affected by firearm-related injuries, it offers one step toward better understanding the short- and long-term impacts of those injuries. Claims data provide a unique lens on how people interact with the health care system. Analyses that include other claims datasets, such as Medicaid and Medicare, and include impacts on family members and loved ones would paint a more complete picture of the impact of firearm-related injuries on the U.S. health care system and population.
Methodology
ESI spending and utilization trends were calculated using the HCCUR methodology. We weighted spending and utilization using ESI weights to develop estimates that were representative of the national ESI population younger than 65. ESI weights were calculated using the American Community Survey (ACS) 2020 5-year estimates Public Use Microdata Sample (PUMS). We excluded enrollees with evidence of non-ESI plan or claims where health plan was not the primary payer.
We identified our incident firearm injury cohort in HCCI data between 2016 and 2020 as follows:
- We used the following ICD-10 codes in any diagnosis position to identify incident firearm injury cohort: W32x, W33x, W34x, X72x, X73x, X93x, X94x, X95x, Y22x, Y23x, Y24x, Y350x, U014x
- We required continuous one year pre-/post- of index date, defined as date of first observed firearm injury in claim.
- For completeness of totality of the incident acute firearm event, we defined spending -/14 days, inclusive of incident index date.
- Health care service categories were classified using methodology from the Health Care Cost and Utilization Report.
- We excluded spending within 45 days of the incident gun injury from the monthly analysis due to firearm-related spending spillovers that distort pre-/post- trends. For example, a person can be admitted for a trauma inpatient stay due to firearm injury but we are not always able to observe the firearm injury diagnosis coded in the claim as more immediate and serious injuries (e.g. respiratory distress, wounds to neck or head) would override the cause of firearm injury diagnosis in billing claims.
Citations
Gani F, Sakran JV, and Canner JK. (2017). Emergency Department Visits For Firearm-Related Injuries In The United States, 2006–14. Health Affairs, 36(10): 1729-1738.
GAO. Report to Congressional Requesters, “Firearm Injuries: Health Care Service Needs and Costs.” June 2021.
Ann Intern Med., 173:949-955.
Spitzer SA, Staudenmayer KL, Tennakoon L, et al. (2017). Costs and Financial Burden of Initial Hospitalizations for Firearm Injuries in the United States, 2006–2014. American Journal of Public Health, 107(5): 770-774.