
The numbers in this report have been updated to reflect the most recent pricing data made available by Sutter Health. While nearly all of the prices remained unchanged (93%), some, generally higher cost services were revised downward by Sutter. For example, in the initial report we found that C-section prices ranged from $7,634 to $89,244 across the Sutter system, whereas in the more recently available Sutter cost sheets, C-section prices ranged from $7,634 to $70,553. Sutter’s updated data also contains additional prices for more services and insurance plans which are included in the updated brief as well.
Background and Historical Context
To combat the ever-increasing rates of health care spending in the U.S., renewed attention has been focused in recent years on the need for greater transparency in the prices of health care services. Many policymakers argue that allowing patients and other purchasers of health care (i.e., employers) to see the dramatic differences in the prices paid for similar health care services could place downward pressure on health care prices, eventually leading to a reduction in spending. This argument has been difficult to test, though, as the needed pricing information has largely been kept secret. Health care prices for the commercially insured – who account for half of health care spending in the U.S. – have frequently been tied up in a maze of legal barriers preventing their publication and dissemination. Even health care prices paid by public payers such as Medicare or Medicaid can be difficult to accurately ascertain given their complex pricing structures. For instance, HCCI recently found that the publicly listed Medicare rates for professional services were 4% higher per service on average than the prices actually paid.
On January 1, 2021, after surviving numerous legal challenges by hospital related-interest groups, a new Department of Health and Human Services regulation took effect, which promised to finally shed light on health care prices. The Federal ruling requires hospitals to disclose their standard charges for a set of at least 300 services deemed shoppable in a publicly accessible and machine-readable format. The rule defines standard charges to include gross charges, payer-specific negotiated rates, out of pocket cash prices, as well as the minimum and maximum negotiated rate per service.
Hospital Compliance with the New Regulations
Now, three months since the regulation took effect, a natural first question might be: have providers actually complied with the new regulation and made their negotiated pricing information public in an understandable and usable manner (i.e., “a single digital file that is in a machine-readable format”)?
A cursory search of 16 hospitals systems comprised of 222 hospitals spanning ten states found that, as of February 2021, half of the sample hospitals published negotiated prices in any manner, and only one-third published negotiated rates in a manner aligned with the regulation’s intent (Figure 1).
Figure 1. Share of Hospitals with Publicized Cost Sheets per the Hospital Transparency Regulation (Published Pricing Data as of 4/01/2021)
| Hospital System Name | State(s) | # of Hospitals | Single, Machine-Readable File | Regardless of Format |
| Mayo Clinic | AZ, FL, MN | 3 | 0 | 0 |
| Sutter Health | CA | 24 | 24 | 24 |
| Univ of Colorado Health | CO | 12 | 0 | 12 |
| Advent Health | FL | 27 | 0 | 0 |
| Indiana University Health | IN | 14 | 0 | 14 |
| UNC Health | NC | 10 | 0 | 10 |
| NYC Health Hospital | NY | 11 | 11 | 11 |
| NY Presbyterian | NY | 11 | 3 | 3 |
| Northwell Health | NY | 18 | 0 | 0 |
| Mount Sinai Health | NY | 17 | 0 | 0 |
| NYU Langone | NY | 6 | 0 | 0 |
| Montefiore | NY | 9 | 0 | 0 |
| Memorial Sloan Kettering | NY | 6 | 0 | 0 |
| Cleveland Clinic Health | OH, FL | 15 | 15 | 15 |
| Baylor Scott & White Health | TX | 27 | 25 | 26 |
| Memorial Herman Health | TX | 12 | 0 | 0 |
| Total | 10 | 222 | 78 | 115 |
| Percent of Total | 35.1% | 51.8% |
The lack of compliance is not necessarily unexpected. The regulation had been criticized for having such low penalties for non-compliance that providers could realistically consider not publishing the information at all. Non-compliant hospitals face a monetary penalty of only $300 per day (totaling just over $100,000 per year). With many hospital systems being multi-million (if not billion) dollar enterprises, it is clear that the incentives for hospitals to comply with this regulation will be mostly reputational, and not financial.
Further, even if hospitals do choose to comply with the regulations, there are very little guidelines regarding what form the information should be posted. For instance, some hospital systems, such as UNC Health, made pricing information public but viewers can only explore one price-service-insurer-facility combination at a time via a series of drop-down menus. Other hospital systems, like IU Health, posted their negotiated rates for all services and all payers via a running string of inconsistently formatted text on a blank webpage, making it nearly impossible for anyone other than experienced coders to interpret. Additionally, nearly every hospital examined – compliant and semi-compliant alike – chose to bury the cost sheets deeply on their site and even adjust the underlying website code to ensure only the most determined researchers could find it.
Case Study: Sutter Health
Despite generally underwhelming compliance with the new regulations, HCCI researchers decided to focus on a single system that has made ample information available and accessible to demonstrate how the release of negotiated rates might result in actionable information for patients or purchasers of health care.
Building off the recent article in the Wall Street Journal, we chose to examine Sutter Health’s publicized price transparency cost sheets. Sutter’s data was made readily available in a consistent and user-friendly format spanning 25 Northern California locations in the hospital system.
Even within the Sutter system, not every hospital published the same information. Different hospitals publicized different sets of services, and some hospitals listed prices for one group of contracted insurers while others had prices for another group. Accordingly, we limited our analysis to prices for six inpatient services that were included in at least ten Sutter hospital cost sheets and 225 outpatient services that were included in at least 20 hospital cost sheets. See the Data, Methods, and Limitations section for more information.
Findings
We found wide variation in commercial service prices paid for by commercial payers by provider, by service, by insurance plan both across and within Sutter hospitals. Within the same hospital, such as California Pacific Medical Center – Van Ness Campus in San Francisco, commercial prices could vary almost 5-fold for an upper GI biopsy with an endoscope or by $32,821 for a C-section delivery. Despite being in the same hospital system, even more dramatic price variation was found across hospitals. For instance, depending on the hospital and commercial plan type, some 4-view knee X-rays cost eight times as much as others, while some major lower joint replacements cost nearly $55,000 more than others.
The dashboard below allows users to explore every published negotiated price for all insurance plans across all Sutter hospitals for all 231 services studied. As commercial patients make up the plurality of the California population (48%), we based our figures to display only the variation in commercial prices for the selected service at each hospital. However, prices paid for the same service by other types of payers (i.e., Medi-Cal) can be added using the drop-down menu at the top of the figure.
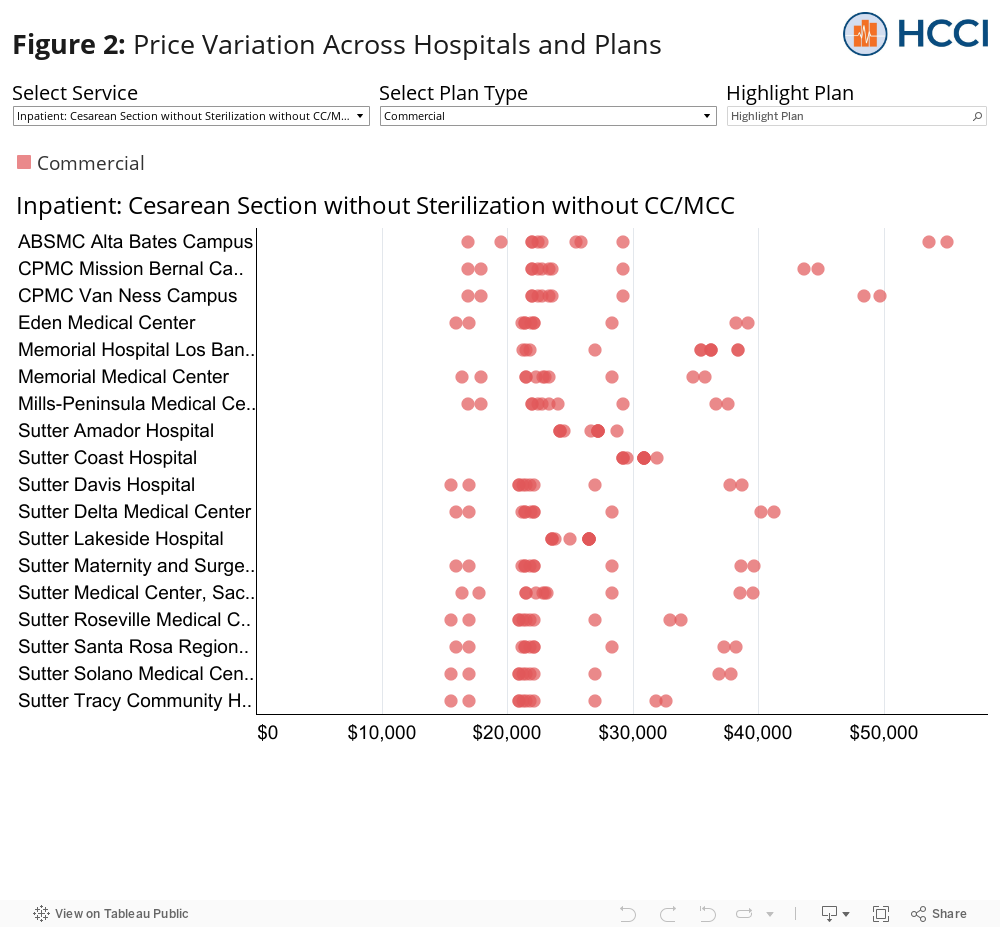
Commercial prices for the same service and the same insurance varied by provider
Despite being in the same hospital system, dramatic price variation was found across hospitals. For example, the HealthSmart PPO plan paid over $53,000 per C-section delivery at Alta Bates Summit Medical Center (ABSMC) – Alta Bates Campus, but paid less than half that for the same service at Sutter Lakeside Hospital ($26,499). This cross-hospital difference in prices was experienced by some of the larger national plans as well. For instance, the price of a C-section delivery for a United PPO plan was $20,920 at Sutter Tracy Hospital, but $36,278 at Memorial Hospital Los Banos, less than 65 miles away.
The differences in prices across hospitals could be seen across every service, as well. For instance, depending on the hospital and commercial plan type, some 4-view knee X-rays cost more than eight times as much as others, while some major lower joint replacements cost nearly $55,000 more than others.
Commercial prices for the same service in the same hospital varied by the kind of insurance product
Significant variation within a hospital across different commercial plans can also be seen in C-section delivery prices. The largest intra-hospital difference in C-section commercial prices was found at ABSMC – Alta Bates Campus in Berkeley, CA. The Multiplan PPO paid $55,031 compared to the United Signature Value Alliance which paid $16,922 – a difference of $38,109 for the same service at the same hospital. The smallest price difference was found at Sutter Coast Hospital (SCH) where the lowest C-section price (Anthem HMO/PPO, $29,210) cost roughly $3,000 less than the most expensive (Cigna HMO/PPO, $31,959). The relatively smaller price range, however, could be due to fewer commercial plans reporting prices at that hospital. Further, despite having less variation, the minimum C-section price at Sutter Coast Hospital was higher than most other commercial C-section prices at most hospitals.
These intra-hospital differences in commercial prices for the same service were also found across all services. For instance, within California Pacific Medical Center – Van Ness, commercial prices could vary nearly five-fold (upper GI endoscopy with biopsy) or by $32,821 (C-section delivery).
Prices for the same service in the same hospital varied by the kind of payer type
The dashboard also confirms several expected trends. For example, within hospitals, commercial delivery prices were always higher than prices paid by Medi-Cal or Medicare Advantage plans. The dashboard also shows that commercial prices were typically higher than the prices offered to Sutter’s own employee health plans within the same hospital. Generally, commercial prices tended to be less expensive than discounted cash prices and out-of-network (OON) prices.
However, there were some exceptions to these trends. For instance, the HealthSmart PPO and Multiplan PPO C-section delivery prices were more expensive than the cash prices at every hospital. Additionally, the HealthNet Medi-Cal C-section delivery price at Sutter Amador Hospital was more expensive than most commercial prices at 15 other hospitals. These examples further highlight the often counterintuitive nature of health care prices in the US.
Conclusion
We found mixed compliance with the recent federal rule requiring hospitals to publicize their negotiated prices with all contracted insurers, with many hospitals not reporting any information and others reporting information that was incomplete or difficult to find or interpret. Our analysis of one system that seems to have complied with the regulation, Sutter Health, found widespread variation in prices across services, insurance plans, and hospitals. For instance, we found that some commercial plans had negotiated prices for an upper GI biopsy almost five times higher than other commercial plans. Similarly, we found that the price paid for a major joint replacement could be nearly $55,000 more than that of another depending on the Sutter hospital and commercial insurance plan.
While it is unclear if the disclosure of these prices will influence any patients to change where they seek care, that employers can now see the various price levels across different health insurers might prompt more “smart shopping” for their employees’ health insurance plan. This could, in turn, put more pressure on insurers to compete for customers through better negotiated rates. However, this analysis pertains to just a single hospital system in the Bay Area. For employers to make more truly informed decisions and to offer their employees a sufficiently broad provider network, they need access to similar data across multiple providers and systems, either through greater hospital compliance with existing regulations or through other means such as a national or state APCD.
Data, Methods, and Limitations
We pulled the publicly available cost sheets for the 25 hospitals/campuses within the Sutter Health System from the Sutter website. The charges and negotiated prices listed in the cost sheets did not contain the same groupings of services and health insurance plans across hospitals. As such, we limited our sample of services to the 225 outpatient services that had a publicized negotiated price for at least one insurer at 80% of Sutter locations (20 locations) and the 6 inpatient services that has a publicized negotiated price for at least one insurer at 40% of Sutter locations (10 hospitals). While all a part of the same health system, not all Sutter hospitals were the same. For instance, some hospitals had less than a 50-bed occupancy while others had more than 300 beds. In this blog, however, we only compare the publicized prices on the cost sheets across hospitals and do not explore the impact of utilization or the impacts of price and use on spending. We grouped negotiated prices into 7 insurance plan categories: gross charges, cash discount, out-of-network commercial, in-network commercial (“Commercial”), Sutter, Medicare Advantage, and Medi-Cal. Not every plan category had an existing negotiated price for every sample service at each hospital. This can lead to an under (or over) estimation of the range of prices offered across or within a hospital for any given service.