
Updated 4/16/2021 to include data through 12/30/2020. Since the original post on 9/9/2020, the data have been adjusted to account for claims submission lags. For more information, see Methods Note below.
COVID-19 has had an extraordinary impact on the US health care system since its emergence in early 2020. One of the largest and most immediate impacts has been the death toll, with the pandemic having claimed more than 560,000 lives as of April 16th, 2021, but the pandemic has also brought a set of (seemingly endless) new trade-offs and choices for people to make as they navigate their daily lives and the health care system. Among them, whether, when, and how to resume their pre-pandemic health care life. How do the risks of leaving their homes and going to medical facilities stack up against the well-documented benefits of preventive care? Whether annual mammograms or other screenings or children’s well-child visits and immunizations, each venture into non-emergency health care sparks a calculus of risk and reward without a clear answer.
Several studies have identified a substantial drop in health care utilization in March and April as most medical offices closed or dramatically scaled back operations, and people generally avoided interactions with the health system in the hopes of not contracting the virus, including reductions in outpatient visits, emergency department visits, and elective surgeries like lower joint replacement. However, these studies were often limited in scale and scope. Curious about the effect the pandemic is having on which health care services people receive, the Health Care Cost Institute (HCCI) looked at a sample of health claims clearinghouse records from 18 states containing 184 million claims from 30 million patients in 2019 and 94 million claims from 20 million patients for the first 6 months in 2020. Specifically, we examined women’s preventative health services, select services provided during pregnancy and delivery, childhood immunizations, and other sentinel preventive medical services including colonoscopies, and prostate-specific antigen (PSA) tests. Overall, we found that the pandemic is having a significant dampening effect on the use of certain health care services.
Figure 1 compares use of the select services between 2020 and 2019 using a 7-day rolling average. Note that the counts of more recent claims have been adjusted to compensate for delays in provider’s submission of claims, and may change slightly as more claims become available. See methods note for more information. Also, note that spikes in the data occur as a result of federal holidays.
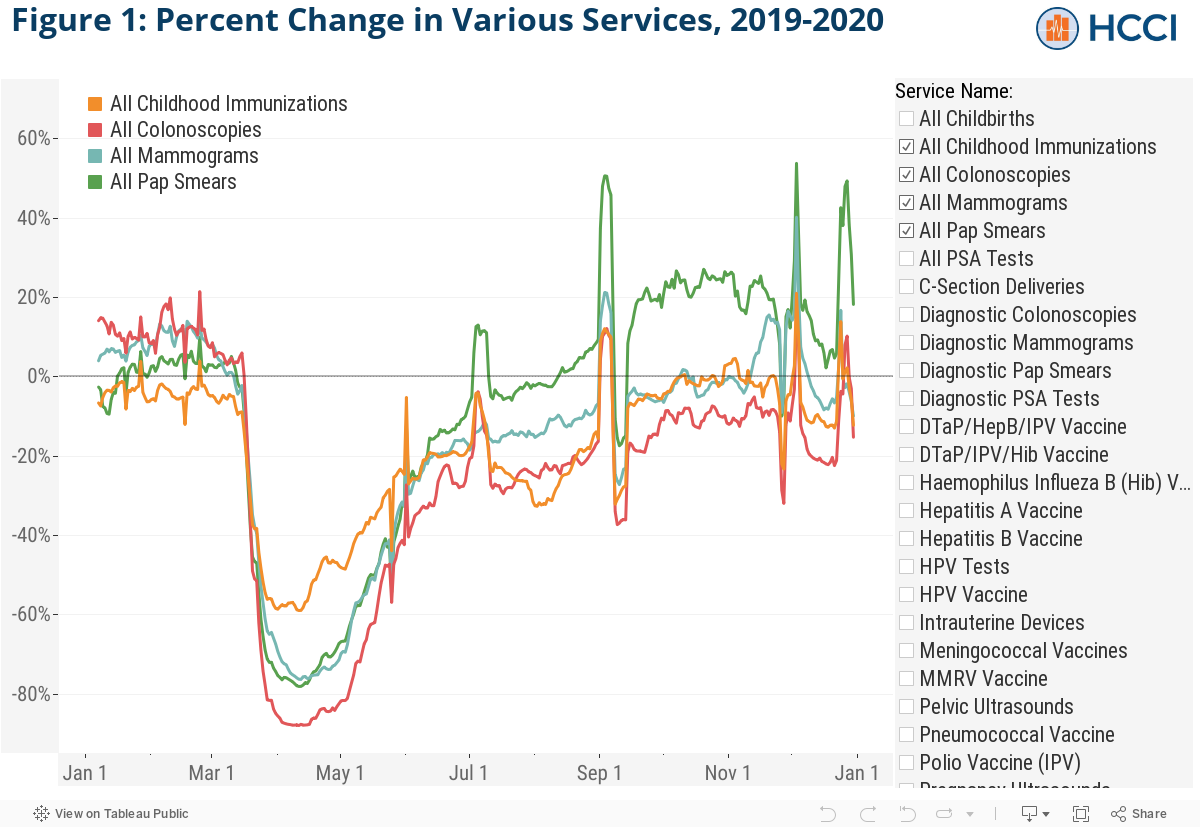
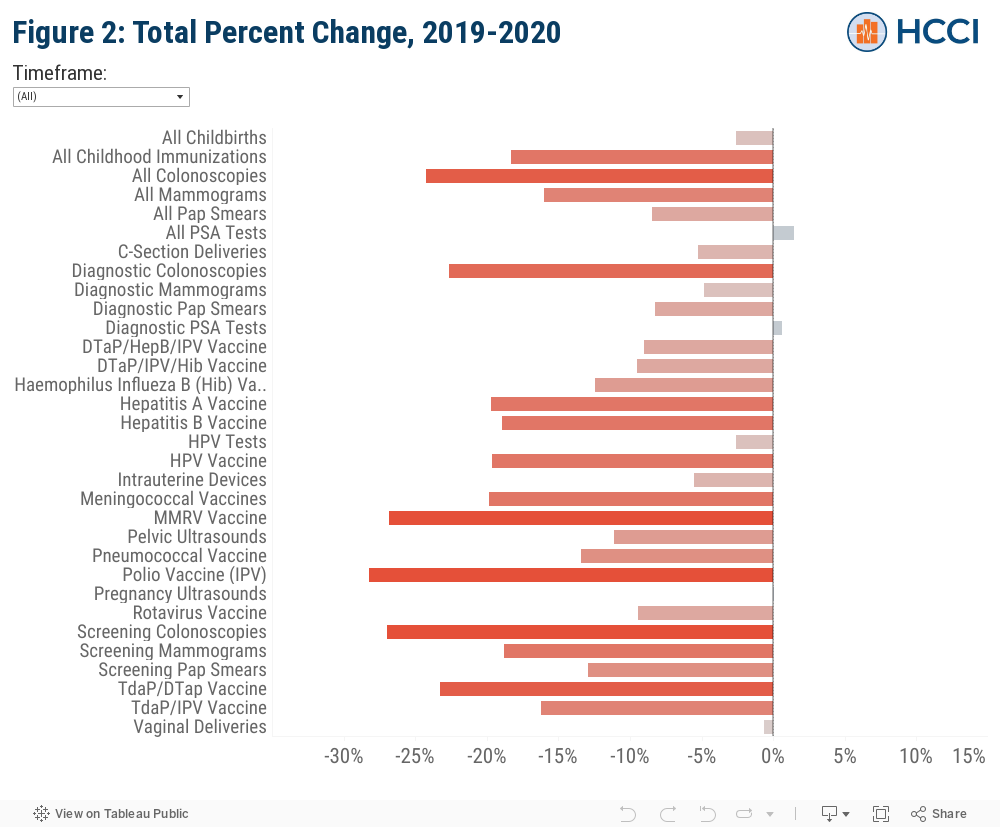
Figure 2 shows the percent change in utilization for each service in the 2020 calendar year compared to the 2019 calendar year. The dropdown menu can be used to adjust the time period to before or after March 13th, 2020 (when many jurisdictions issued a state of emergency), in order to compare service use in that date range in 2020 to the same time period in 2019. “Before March 13th” captures changes in the amount a service was performed during 1/1/2020 – 3/12/2020 compared to 1/1/2019 – 3/12/2019, and “After March 13th” shows changes in service use for 3/13/2020 – 12/31/2020 compared to 3/13/2019 – 12/31/2019. Note that these data are not adjusted for the patient panel composition, including age and sex, and cannot account for changes in demographics between years.
Submitted claims for most preventive services we examined, such as mammography and childhood immunizations exhibited significant declines in 2020 compared to 2019, particularly mid-March through mid-April. Even through the end of December 2020, utilization of some preventive services appeared to be running below 2019 levels. Trends from the data through December 30, 2020 show:
- Childhood immunizations were, on aggregate, down about 60 percent in mid-April in 2020 compared to 2019. This ranged from 75 percent for Meningococcal and HPV vaccines to 33 percent for Rotavirus and the diphtheria, tetanus toxoids, acellular pertussis family of vaccines. In 2020, childhood immunizations declined about 18% for the year compared to 2019.
- Mammograms and Pap smears were down nearly 80 percent in April 2020 compared to 2019. However, both services recovered throughout the summer and fall, with Pap smears and mammograms rebounding above 2019 levels in August and November, respectively.
- Colonoscopies, down almost 90% at one point in mid-April 2020 compared to 2019, are as of December 2020 still down about 15% compared to last year, representing a substantial but incomplete rebound in care delivered. The number of colonoscopies performed in 2020 overall declined by almost 25% from 2019.
- PSA tests, which are used for prostate cancer screening, while down approximately 70% in early April, have seen a strong rebound, with delivery of PSA tests returning to 2019 levels starting in June, and reaching ~25% above 2019 levels in September 2020. Unlike many other services, PSA tests did not decline in 2020 overall compared to 2019.
- Use of services that cannot be deferred or forgone, like childbirth, have tracked more closely to 2019 levels. All deliveries declined by about 2.6 percent on average from 2019 to 2020. Cesarean section deliveries declined slightly more than vaginal deliveries (approximately 5 percent and <1 percent, respectively), perhaps reflecting changes in preferences towards early elective deliveries, which tend to have longer lengths of stay than vaginal deliveries, though additional research is needed to understand what is leading to the difference in utilization.
This analysis is merely a preliminary glimpse at the impact of COVID-19 on health care utilization in 2020 and is not intended to provide definitive answers about the ways in which the pandemic is affecting people’s health care. We expect HCCI’s new national dataset, with more than 1 billion claims for approximately 55 million people with employer-sponsored health insurance coverage, which launched in early 2021, will facilitate a much more comprehensive assessment of those questions. These data suggest, though, that for now, people have chosen to forego care they would otherwise have received with potential implications for their long-term health and well-being.
Methods Note
This study uses data made available by the COVID-19 Research Database, a cross-industry collaborative contributing real world, de-identified data to researchers wishing to study issues related to COVID-19. For this analysis we used a clearinghouse database which spanned 184 million claims from almost 30 million patients in 2019 and 94 million claims from nearly 20 million patients in the first 6 months in 2020. The claims were all from members who resided in a consistent set of 18 states, with roughly half living in California in both study years. Lastly, while the claims were associated with all payer types, they were predominately from the commercially insured: 86% commercial (ESI and MA), 12% Medicare, and 2% Medicaid, on average across both years.
Claims clearinghouses are responsible for scrubbing and transmitting medical claims to insurance carriers. Once a response is received from the issuer, the clearinghouse transmits the denial or acceptance of the claim back to the provider. While some clearinghouses may transmit payment information back to the provider, typically only charge data are reliably available from the clearinghouse. Additionally, accurate enrollment files may not be available since they are maintained by the issuer, which presents a limitation for this type of analysis.
We defined our services of interest from physician and other professional service charges (i.e. non-facility charges) as the count of unique claims from the charge submissions for the following HCPCS/CPT codes:
| Women’s Preventative Health Services | HCPCS/CPT Codes |
| Diagnostic pap smear (cytopathology) | 88141, 88142, 88143, 88147, 88148, 88150, 88152, 88153, 88155, 88164, 88165, 88166, 88167, 88174, 88175 |
| Screening pap smear (cytopathology) | P3000, G0123, G0143, G0145, G0146, G0147, G0148 |
| Diagnostic mammography | 77055, 77056, 77066, 77065 |
| Screening mammography | 77057, 77067 |
| Birth control, IUD | J7297, J7298 |
| Ultrasound, pelvic (non-obstetric) | 76858, 76857, 76830 |
| Human papilloma virus (HPV) test | 87623, 87624 |
| Pregnancy and Delivery | HCPCS/CPT Codes |
| Ultrasound, pregnancy | 76801, 76802, 76805, 76810, 76811, 76812, 76817 |
| Childbirth, Caesarian section | 59510, 59514, 59515, 59618, 59620, 59622, 59409, 59612 |
| Childbirth, vaginal delivery | 59400, 59409, 59410, 59610, 59614 |
| Childhood Immunizations | HCPCS/CPT Codes |
| Measles, mumps, rubella, varicella | 90707, 90710, 90716 |
| Hepatitis A | 90633 |
| Hepatitis B | 90744 |
| Haemophilus influenza type b (Hib) | 90647, 90648 |
| Human papilloma virus (HPV) | 90651 |
| Rotavirus | 90680, 90681 |
| Pneumococcal conjugate | 90670 |
| Meningococcal | 90620, 90621, 90734 |
| Poliovirus vaccine, inactivated (IPV) | 90713 |
| Diphtheria, tetanus toxoids, acellular pertussis (Td/DTaP/Tdap) | 90700, 90714, 90715 |
| Diphtheria, tetanus toxoids, and acellular pertussis vaccine and inactivated poliovirus vaccine (DTaP-IPV) | 90696 |
| Diphtheria, tetanus toxoids, acellular pertussis vaccine, haemophilus influenza type b, and inactivated poliovirus vaccine (DTaP-IPV/Hib) | 90698 |
| Diphtheria, tetanus toxoids, acellular pertussis vaccine, Hepatitis B, and inactivated poliovirus vaccine (DTaP-Hep BIPV) | 90723 |
| Other Health Services | HCPCS/CPT Codes |
| Diagnostic colonoscopy | 45379, 45380, 45381, 45382, 45383, 45384, 45385, 45386, 45387, 45388, 45389, 45390, 45391, 45392, 45393, 45394, 45395, 45396, 45397, 45398 |
| Screening colonoscopy | 45378, G0105, G0121 |
| Diagnostic prostate-specific antigen (PSA) test | 84153 |
| Screening prostate-specific antigen (PSA) test | G0103 |
| Influenza vaccine | 90653, 90694, 90662, 90672, 90674, 90682, 90685, 90686, 90687, 90688, 90756, 90656, 90662, Q2035 |
The table below shows the total count of claims used for this analysis by service and by year, from January 1 to October 2 in each year.
| Service Name | 2019 Count | 2020 Count | Adjusted 2020 Count |
| All Childbirths | 168,844 | 161,866 | 164,490 |
| All Childhood Immunizations | 4,875,661 | 3,922,691 | 3,982,702 |
| All Colonoscopies | 451,511 | 336,875 | 341,896 |
| All Mammograms | 934,376 | 775,659 | 784,765 |
| All Pap Smears | 1,201,054 | 1,086,687 | 1,099,326 |
| All PSA Tests | 980,294 | 978,193 | 994,264 |
| C-Section Deliveries | 71,203 | 66,357 | 67,454 |
| Diagnostic Colonoscopies | 284,231 | 216,613 | 219,971 |
| Diagnostic Mammograms | 186,359 | 174,856 | 177,312 |
| Diagnostic Pap Smears | 1,165,751 | 1,056,550 | 1,069,816 |
| Diagnostic PSA Tests | 947,341 | 937,977 | 952,921 |
| DTaP/HepB/IPV Vaccine | 150,460 | 134,624 | 136,908 |
| DTaP/IPV/Hib Vaccine | 253,893 | 226,577 | 229,758 |
| Haemophilus Influeza B (Hib) Vaccine | 313,518 | 269,728 | 274,511 |
| Hepatitis A Vaccine | 397,211 | 314,979 | 318,996 |
| Hepatitis B Vaccine | 241,361 | 192,906 | 195,694 |
| HPV Tests | 639,102 | 616,279 | 622,519 |
| HPV Vaccine | 384,005 | 304,265 | 308,500 |
| Intrauterine Devices | 25,702 | 23,784 | 24,283 |
| Meningococcal Vaccines | 466,878 | 368,806 | 374,365 |
| MMRV Vaccine | 524,689 | 378,962 | 383,996 |
| Pelvic Ultrasounds | 482,835 | 423,059 | 429,270 |
| Pneumococcal Vaccine | 678,511 | 575,722 | 587,400 |
| Polio Vaccine (IPV) | 156,516 | 110,811 | 112,317 |
| Pregnancy Ultrasounds | 393,145 | 388,616 | 393,471 |
| Rotavirus Vaccine | 333,958 | 297,678 | 302,397 |
| Screening Colonoscopies | 167,280 | 120,262 | 122,160 |
| Screening Mammograms | 748,017 | 600,803 | 607,230 |
| Screening Pap Smears | 35,303 | 30,137 | 30,743 |
| TdaP/DTap Vaccine | 841,407 | 637,344 | 645,798 |
| TdaP/IPV Vaccine | 133,254 | 110,289 | 111,611 |
| Vaginal Deliveries | 97,641 | 95,509 | 96,988 |
Percent Change for each service on a given day of the year is calculated as the difference between the 2020 and 2019 values divided by the 2019 value, then multiplied by 100. That is, Percent Change = (([2020]-[2019])/[2019])×100.
We attempted to stratify the data by gender and age, however, demographic data for claims submitted in 2020 was significantly more incomplete than the demographic information on claims from 2019. While more specificity in the demographic profile of these services is important, the preventative screenings, tests, and procedures, selected (with the exception of colonoscopies and HIV tests), are utilized primality by a single sex, and immunizations are primarily utilized by children.
Trends were calculated using a 7-day rolling average, and we include a 60-day run out window from the date of data extract to allow for sufficient claims maturity. Note that inferences made comparing 2019 utilization to 2020 utilization may be influenced by factors not related to patients delaying or foregoing care. These factors include but are not limited to claims lag beyond our 60-day window, and the possible change in the mix of providers utilizing the clearinghouse from which these data are derived or a change in the mix of the types of patients being served.
We differentiate diagnostic services from screenings using their respective HCPCS/CPT codes. There may be limitations to our results related to how payers reimburse these services as some payers may require different or additional mechanisms for documenting diagnostic or screening services other than the HCPCS/CPT code.
We also do not discuss impacts of the pandemic on the utilization of telehealth services or other service substitutions, however, with the exception of HIV testing and pregnancy testing, none of these services are customarily performed without direct care from a health professional. While we can’t fully attribute the dips in preventative care to patient’s decisions to delay/forego care (e.g. many providers may have been closed during shutdown orders), this does represent a meaningful shift in the delivery of services.
Finally, the data from these findings are overly representative of the western U.S. and not generalizable to the entire population of insured persons.
The data, technology, and services used in the generation of these research findings were generously supplied pro bono by the COVID-19 Research Database partners, who are acknowledged at https://covid19researchdatabase.org/.
Note on adjusting for claim lags:
Research using claims data must contend with the fact that there is a lag between when a service is performed and when the provider submits a claim. This lag in claims maturity is highly variable, with some claims requiring a full year to fully mature. The immediate needs for health services information during the pandemic must be balanced against this slow claims data submission process. For this reason, we allow for a minimum sixty-day runout period for claims to be submitted before we analyze the data. Although traditional research in health services will use claims data with at least a year of maturity, the goal of this analysis is to provide data in real time, necessitating this trade-off. However, since claims sometimes take longer than sixty days to be submitted, our data is still incomplete, especially towards the more recent service dates.
In order to get a better sense of what the data may look like after all the claims are completed, we attempted to make predictions for the additional number of claims that will be recorded, based on the number of claims that were added between 8/26/20 and 2/01/21 (the earliest and most recent dates on which we extracted the data, respectively). Across services, the number of claims that appear in the second data pull but are missing in the first data pull consistently rose as the service date neared the date of the first data pull, and we observed that this trend more resembled exponential decay as opposed to a linear trend.

We built a simple regression model to predict the claims on any given day based on the time relative to the data pull. Because of the trend in claims relative to the date, we log-transformed the outcome variable. We also allowed this trend to vary by service. To do so, we included an interaction term with the time relative to the data pull and service-specific dummy variables. The model can be written as:
ln(Yit) = β0 + β1X1 + β2X2,i + β3X1X2,i + εit
Where:
Yit = Completion factor for service i on day t, i.e. the number of additional claims outstanding, expressed as a percentage of recorded claims
X1 = The number of days between the service date t and the date the data is pulled
X2,i = Indicator variable for each specific service i
The model was fitted to our data from 8/26/20, with the additional claims that were added by 2/01/21 serving as the outcome variable. The model had an adjusted R2 of 0.81, and will be continually tested and re-fitted with future rounds of data.
In order to get a prediction of the total claims lag (i.e. not just the additional claims that show up after 159 more days of runout, but all the additional claims yet to be recorded), we added together the predicted percentage of additional claims for each day t with those for the day 159 days prior (i.e. Yt + Yt-159 ). For example, for the most recent service date, if a provider submitted a claim within 0-60 days, that claim is already recorded in the data. To adjust for the number of claims from that date that take longer than 60 days to be submitted, we added together the predicted number of claims with a 61-229 day lag and a 230-388 day lag, creating an estimate of the claim count after practically all the claims are recorded. Finally, we added the predicted number of additional claims to the recorded claims from the most recent round of data (extracted 2/01/2021) to create lag-adjusted claim counts and to calculate the percent change in service utilization from 2019 to 2020. The chart below shows how some of our adjusted numbers compare to the unadjusted ones. An interactive version of this chart with all services can be found here.

The table below shows a subset of our calculated completion factors (the predicted additional claims as a fraction of recorded claims) and adjusted claim counts for total vaccinations on selected dates.
