
Childbirth is the most frequent reason for an inpatient admission in the United States, and Cesarean-section (C-section) is the most common operating room procedure in an inpatient hospital stay. Among people who get insurance through an employer, the combination of labor, delivery, and newborn care makes up nearly one in six dollars spent on inpatient care. Childbirth accounts for an estimated four out of every five dollars spent on maternal-newborn health care. Consequently, childbirth is a significant element of health care utilization and spending, particularly for hospitals.
We used Health Care Cost Institute data to better understand spending on childbirth among the commercially insured in the United States. Using diagnostic information, we compiled a pooled sample of 351,272 deliveries across 35 states from 2016 and 2017. We measured the cost of childbirth admissions using allowed amounts – the sum of all insurer and patient out-of-pocket spending. To provide a more complete picture of health care spending associated with childbirth admissions, we combined all facility and professional claims associated with each inpatient admission.
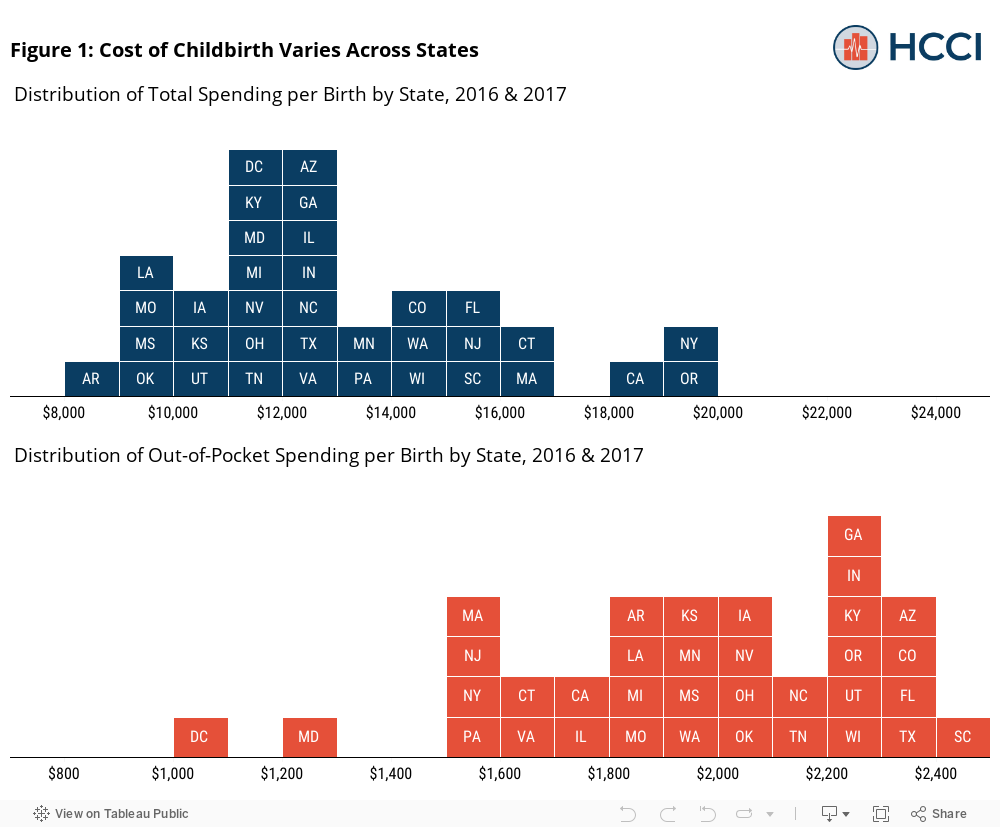
We found widespread variation in the cost of childbirth in the U.S. ranging from $8,361 in Arkansas to $19,771 in New York. To better understand what may be contributing to this variation, we looked at differences in the average prices for vaginal birth across regions, the frequency with which C-sections are performed, and the relative costs of C-sections and vaginal births. We found that variation in the cost of vaginal births is the primary driver of geographic variation in spending per childbirth.
The Cost of Childbirth Varies Widely Across the United States
Nationally, we find that spending on a childbirth admission for individuals with employer-sponsored insurance averaged $13,811 – the sum of insurer and out-of-pocket payments to the facility and all other providers. As noted above, average cost varied widely across states with the average cost in New York more than double the average cost in Arkansas.
It is not just overall spending that differs across the U.S. Individuals’ out-of-pocket costs for childbirth also varied dramatically across states [Figure 1]. Average out-of-pocket spending ranged from $1,077 in Washington, D.C. to $2,473 in South Carolina. Variation in out-of-pocket costs reflect several factors, including variation in the cost of childbirth as well as variation in benefit design.
Several Factors Explain Variation in the Cost of Childbirth
Spending on childbirth can vary both by spending per type of childbirth procedure and the use of different procedures. Among childbirth admissions, children are delivered by one of two procedures – either by vaginal birth or C-section. Because C-sections are a more intensive surgical procedure, they are typically associated with longer, more expensive admissions.
Variation in Spending per Birth
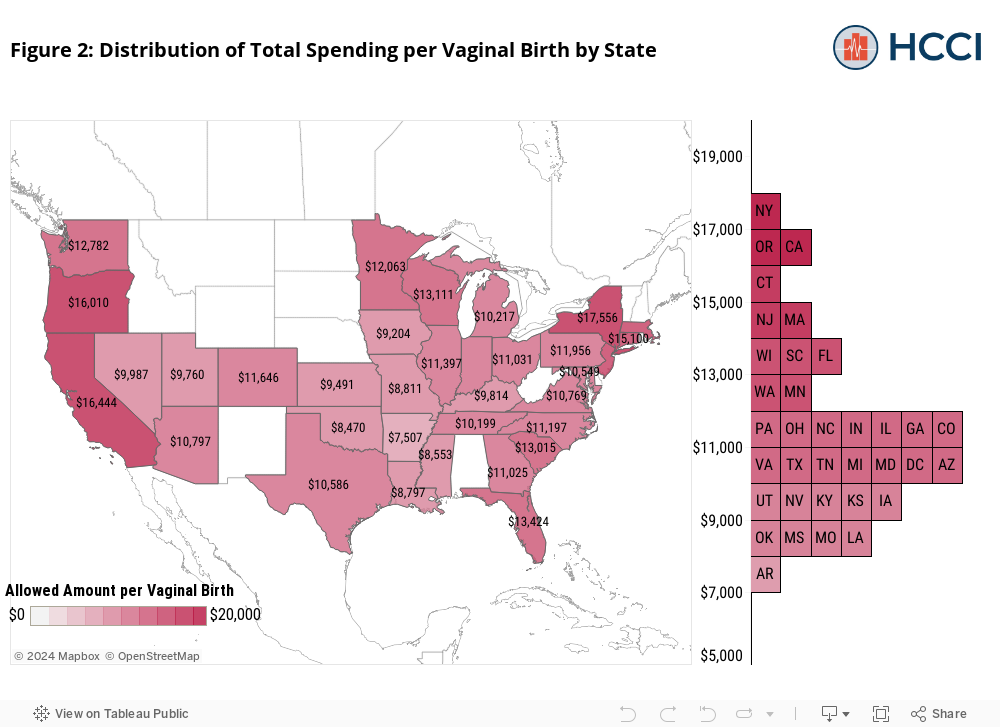
We find that spending per vaginal birth varies across states. For example, spending on vaginal birth ranges from $7,507 in Arkansas to $17,556 in New York. In general, California and northeastern states had higher spending per vaginal birth compared to midwestern and southern states. These differences in average spending per vaginal delivery could be due to a combination of variation in provider prices and the intensity of cases presenting in different states.
Variation in Procedure Use
We also find differences in which delivery type is performed across states. This variation in use of childbirth procedures can contribute to variation in spending, as C-sections are typically a more expensive delivery method, so the average cost of childbirth may vary across states due to the frequency at which C-sections are performed. Wide variation in C-section rates can be partially explained by hospital, patient, and county characteristics. However, physician and hospital payment structures also play an important role in the decision to deliver with a C-section. Areas with particularly high C-section use suggest that these procedures may be performed on births where it is not medically appropriate or necessary.
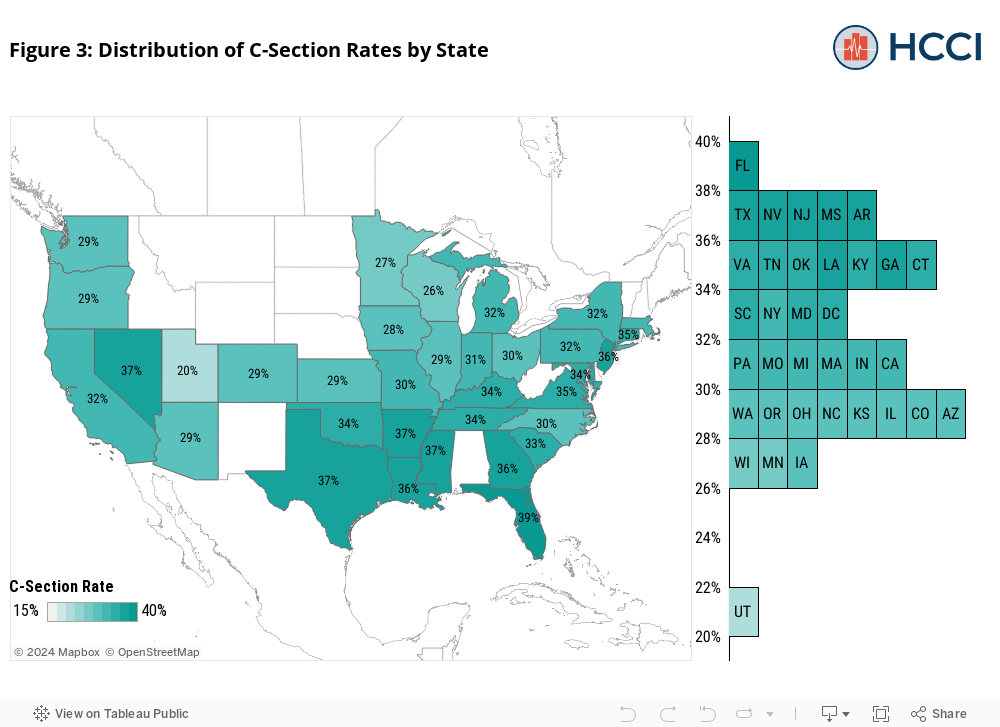
Nationally, nearly 33 percent of the births in our sample were C-sections and the remaining 67 percent were vaginal births. The C-section rate in our sample was comparable to other estimates of the C-section rate in the U.S. (32 percent as estimated by the OECD), which is greater than the OECD average (28 percent) and the World Health Organization’s recommended 10 percent C-section rate. Across states, C-section rates ranged from 20 percent of births in Utah to 39 percent in Florida [Figure 3]. However, in most states we observed C-section rates between 25 and 35 percent. Southeastern and northeastern states had some of the highest C-section rates compared to C-section rates in the Midwest and West.
Variation in the Relative Cost of Different Procedures
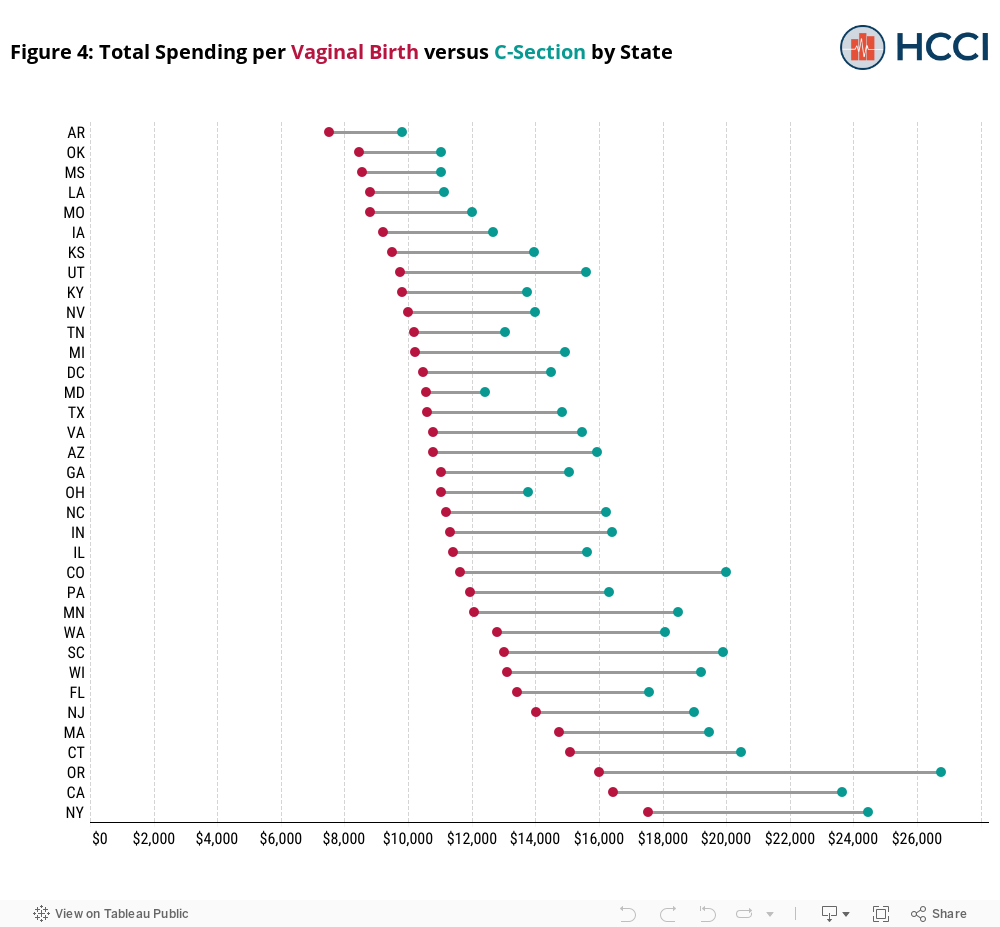
Differences in spending per childbirth across states also may be due to differences between the relative spending per procedure on C-sections and vaginal births. Among our 2016 and 2017 pooled sample of people with employer-sponsored insurance, average spending per vaginal birth nationally was $12,235. Average spending per C-section, in contrast, was $17,004. Although spending per C-section was higher than for vaginal births in all states, the spending difference between the procedures varied nationally. Maryland had the smallest difference in the spending per vaginal birth and C-sections ($1,852) while Oregon had the largest ($10,755). States with higher spending per vaginal birth tended to have greater differences in per procedure spending between vaginal births and C-sections. As a result, coastal states – which tended to have higher spending per vaginal birth – also tended to have a relatively larger difference between per procedure spending on C-sections and vaginal births while southern states observed smaller differences.
Average Prices Drive Variation in Spending per Childbirth
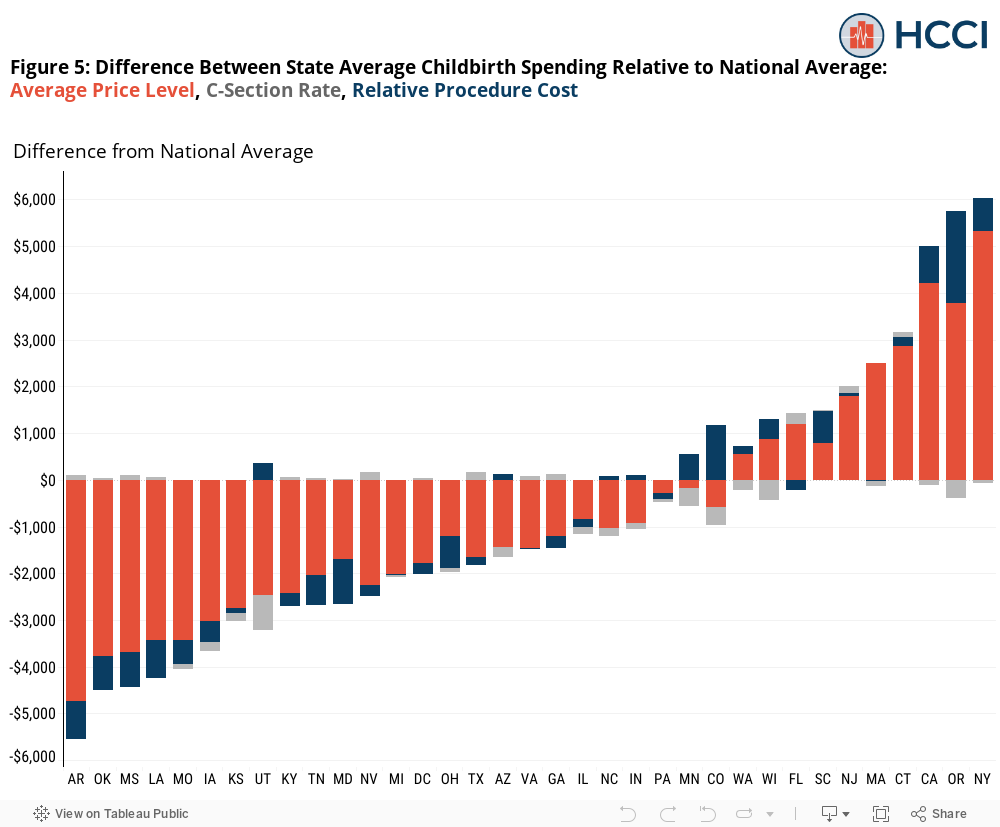
To understand which factors may contribute to the variation in spending per childbirth across the United States, we decomposed the difference between spending per delivery in each state and the national average into three components: average price levels, C-section rate, and relative procedure cost.
Each component measures the difference between spending per childbirth in each state and the national average under different assumptions to measure how each of the components impact variation in the cost of childbirth across states. The average price level component assumes that the C-section rate and the difference between per procedure spending on C-sections and vaginal birth were the same in each state. In other words, it measures the difference between spending per childbirth in each state and the national average if only spending per vaginal birth varied. The C-section rate component assumes that spending per procedure and the difference between spending per C-section and vaginal birth were the same in each state, but only the C-Section rate varied. Lastly, the relative procedure cost component assumes that spending per vaginal birth and C-section rate were the same, but only the per delivery cost of C-sections relative to vaginal births varied.
In almost every state, the average price level accounted for the majority of the difference in spending per childbirth. For example, in Connecticut spending per birth was $16,966 which was $3,155 higher than the national average. Given spending per vaginal birth, if the C-section rate and spending difference between C-sections and vaginal births were the same as the national average in Connecticut, spending per birth would still be $2,865 higher than the national average. Hence, the average price level accounted for 91 percent of the $3,155 difference in spending per birth. Average prices were the primary reason spending per childbirth differed from the national average in every state except for Colorado. In Colorado, average prices and the C-section rate were both below the national average but there was a large difference in spending per C-sections relative to vaginal births.
Conclusion
As stakeholders throughout the health care system work to improve maternal health, these results indicate that having a baby is not the same across the United States, especially with regard to spending. We find that spending per delivery, the relative cost of delivery types, and the rate of Cesarean deliveries all vary across states. Such geographic variation should encourage policy makers to think beyond national policies and address the needs of pregnant people at a regional or state level.
Our findings also suggest that variation in spending per vaginal birth is the primary driver of variation in spending per delivery, and by extension, also an important driver in out-of-pocket cost per delivery. These findings underscore the importance of provider price variation in efforts to curb the cost of childbirth.