
Community Health Centers (CHCs) serve over 29 million vulnerable patients, making the lack of data on COVID-19-related racial disparities in patients served in CHCs a critical knowledge gap in assessments of the pandemic’s national impact. In rural and poor urban areas, CHCs may be the only accessible healthcare option. Even when other options exist, CHCs reduce barriers such as cost, lack of insurance, and distance, making CHCs a critical access point for health care and providing a unique window into the COVID-19 pandemic in these communities.
Data from a January 2021 survey of 928 CHCs administered by the Health Resources & Services Administration (HRSA) found that almost 250,000 patients had been tested for COVID-19 and almost 45,000 had tested positive. The same survey found that among patients of “racial or ethnic minorities,” over half had tested positive for COVID-19. Other earlier research shows worrying disparities in COVID-19-related mortality and positivity rates in Black and Hispanic, and more recently, Asian populations. For example, HCCI’s earlier analyses of electronic medical record data from a convenience sample of ambulatory care patients found Hispanic patients were four times more likely to test positive for COVID and over six times more likely to test positive for antibodies compared to white patients, and Black patients were twice as likely to test positive for COVID and over three times more likely to test positive for COVID antibodies than white patients. Additional research found that disparities persisted over time and across geographic regions.
This study builds on earlier work by assessing electronic health record (EHR) data from OCHIN, a leading collaborative of CHCs across the US, primarily concentrated on the West coast, the Midwest, and the Northeast. We analyzed the COVID-19 positivity rates by race and ethnicity among CHC patients who had confirmed (with the PCR test) or suspected COVID-19 from over 600 CHCs across two regions: the West (California, Oregon, Washington) and New England (Maine, Massachusetts, New Hampshire, Vermont, Rhode Island). More information on the methodology of this report can be found in the methods section at the bottom of the page.
COVID Positivity Among the CHC Population Studied
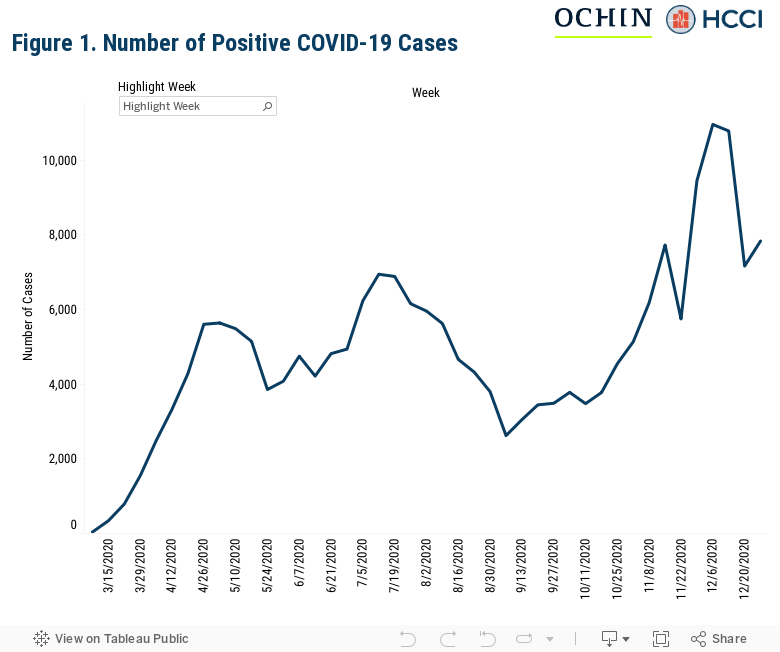
Since the beginning of March 2020, over 213,000 of the over 4.6 million visits to studied OCHIN clinics resulted in positive or suspected COVID-19 results (over 4.5 percent). Figure 2 shows weekly total counts of patients testing positive. The number of positive cases increased with each subsequent peak, with the first occurring in April, the next in July, and another in December, following national trends in infection prevalence across the country.
Hispanic, non-Hispanic Black, and non-Hispanic Asian Patients Experience a High Incidence of COVID-19
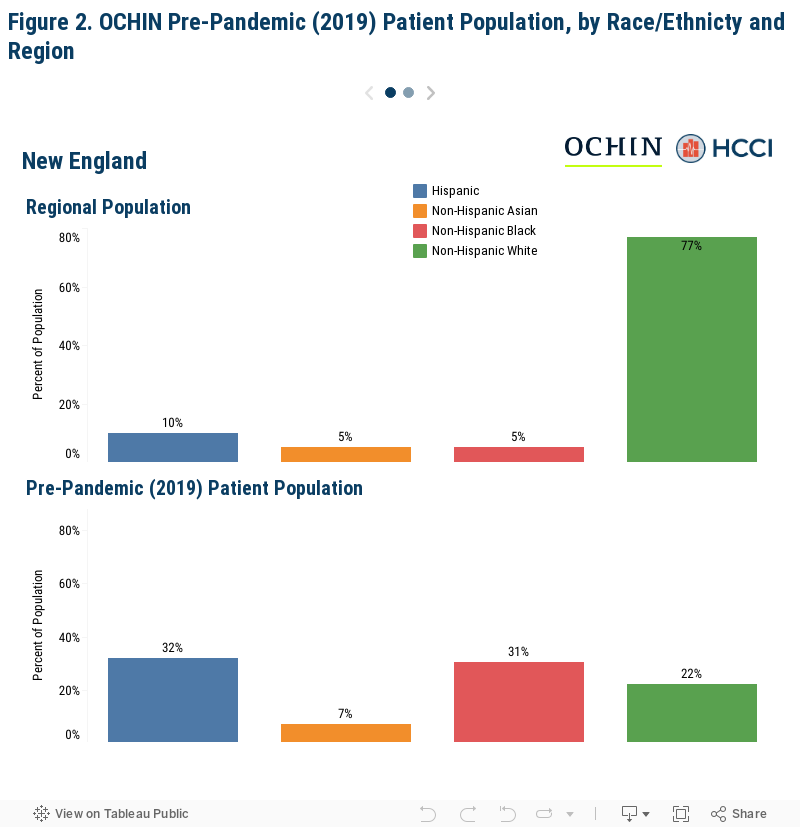
Among OCHIN’s CHC population in 2019, before the COVID-19 pandemic began in the United States, approximately, 32 percent of patients were Hispanic of any race, 7 percent were non-Hispanic Asian patients, 31 percent were non-Hispanic, Black patients, and 22 percent were non-Hispanic, white patients. Race and ethnicity among patients varied across the two regions of focus. Figure 2 shows the proportion of Hispanic, non-Hispanic Asian, non-Hispanic Black, and non-Hispanic white patients served in the OCHIN Networks in 2019 and in the region overall, using data collected from the 2018 US Census estimates. When compared to the race and ethnicity census estimates, OCHIN’s patient population had a greater proportion of Hispanic, non-Hispanic Asian, and non-Hispanic Black patients, and a smaller proportion of non-Hispanic white patients in New England, and a greater proportion of Hispanic and non-Hispanic Black patients, and a smaller proportion of non-Hispanic Asian and non-Hispanic white patients in the West.
On average, our preliminary, unadjusted analyses showed non-Hispanic Black and non-Hispanic Asian with a positivity rate of 5 percent, while Hispanic patients had a positivity rate of 6 percent and non-Hispanic white patients had a positivity rate of 3 percent during the study period.
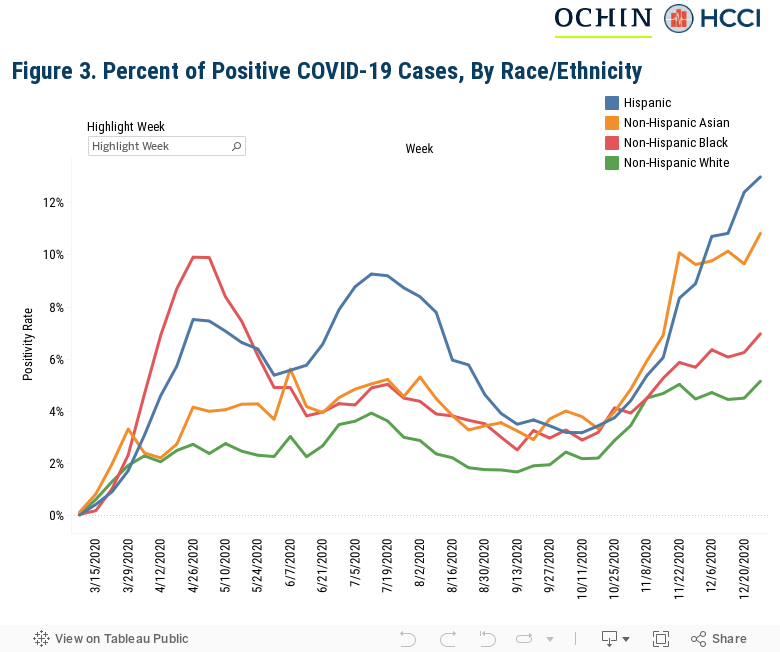
As noted above, anecdotal reports and earlier research have highlighted disturbing disparities in COVID-19-related mortality and infection rates, particularly for Black, Hispanic, and Asian individuals. At the start of May, in the OCHIN CHC network, preliminary, unadjusted analyses showed non-Hispanic Black, Hispanic, and non-Hispanic Asian patients to be more likely than white patients to be diagnosed with COVID-19. In July, white patients’ positivity rate increased to 4 percent while Hispanic patients had a positivity rate of 8 percent and non-Hispanic Black and Asian patients both had a rate of 5 percent. In the last week of December, Hispanic patients had a positivity rate of 13 percent, non-Hispanic Asian patients had a positivity rate of 11 percent, and non-Hispanic Black patients had a positivity rate of 7 percent. Non-Hipspanic white patients had a positivity rate of 5 percent during the same period. Cases among Hispanic and non-Hispanic Black patients climbed the fastest earlier on in the pandemic, and then dropped off slightly for non-Hispanic Black patients while remaining high for Hispanic patients. Asian patients saw a dramatic increase in positivity rate at the end of 2020.
Disparities in Disease Burden among Hispanic, non-Hispanic Black, and non-Hispanic Asian Individuals Persist Across Regions at CHCs
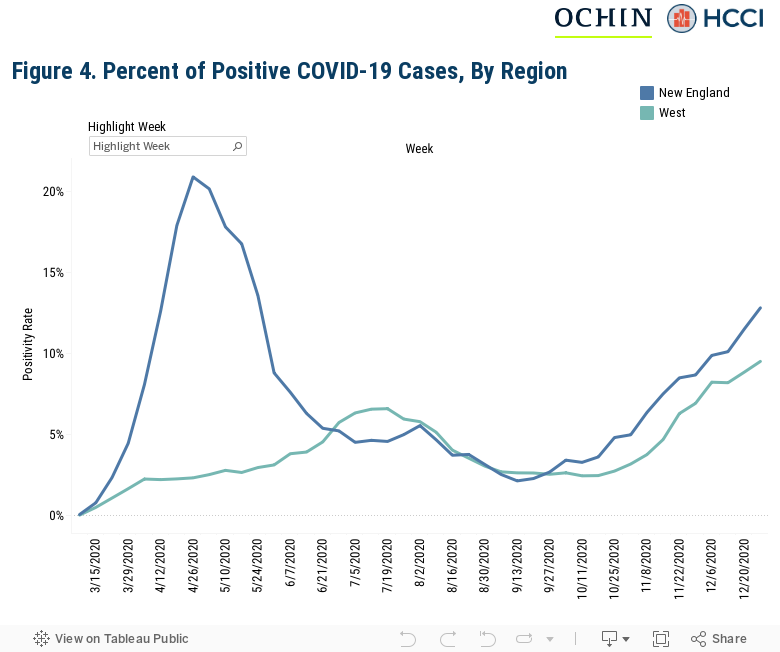
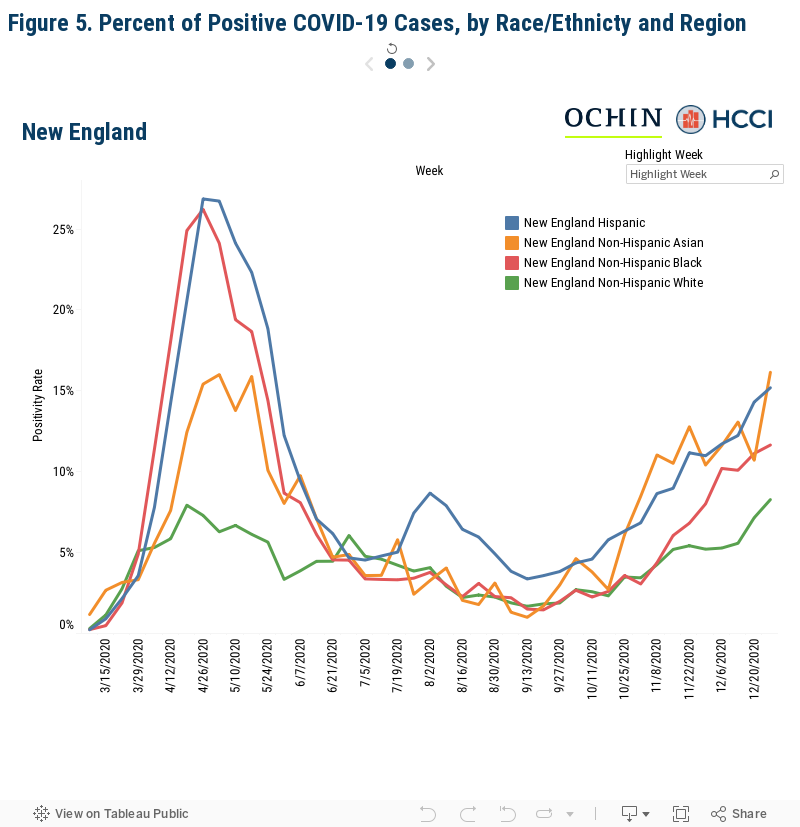
Similar to other research that examined the regional disparities in the incidence of COVID-19 in data from a convenience sample of ambulatory care EMRs, we also found regional variation among CHCs. Figures 4 and 5 show how the regional variation in positive case rates varied among Hispanic, non-Hispanic Black, non-Hispanic Asian, and white patients. New England had the highest percentage of positive cases in the study period, peaking at 21 percent in the last week of April. For Hispanic and non-Hispanic Black patients, the positivity rate was 27 percent and 26 percent, respectively. In July/August, the West saw a greater positivity rate than New England overall, though Hispanic patients had a similar positivity rate in both regions of 9 percent. Both regions’ positivity rates increased between October and December, from 3 percent at the start of October to 10 percent in the West and 13 percent in New England. Non-Hispanic Black, non-Hispanic Asian, and Hispanic patients experienced higher positivity rates consistently throughout the study period. In both regions, at the end of December, the positivity rate for non-Hispanic Asian patients increased dramatically, to 10 percent in the West and 16 percent in New England.
Community Health Centers’ Unique Experience During the Pandemic Underscores the Need to Address COVID’s Disproportionate Impact on Hispanic, Black and Asian Individuals
Similar to national data, Black, Hispanic, and Asian patients experienced higher COVID-19 positivity rates than did white patients and previous research in other ambulatory settings has shown similar disparities as those seen among CHC patients. As seen in other health care settings, the COVID-19 pandemic highlights persistent and systemic racism that puts some groups at higher risk of contracting COVID-19 because of where they work or where they live. There is a dire need to better understand these patterns comprehensively to support the development of effective interventions for reducing COVID-19 transmission among Black, Hispanic, and Asian individuals and improving outcomes during this pandemic.
Those served by CHCs are among society’s most vulnerable, underscoring the critical need for a greater understanding of the role of CHCs as a front-line provider of COVID-19 care. As the COVID-19 pandemic progresses, it is vital that these critical access points to health care maintain their ability to respond and provide care to patients both at risk and testing positive. This support is not guaranteed; indeed, NACHC is predicting a six-month loss of over $7.6 billion and over 100,000 jobs as a result of the pandemic.
This work was supported by the Robert Wood Johnson Foundation and in collaboration with OCHIN and Berkeley Research Group.
Background and Methods
Data Source
OCHIN is a driving force for health equity. A national nonprofit health IT organization with two decades of experience transforming health care delivery, OCHIN provides leading-edge technology, data analytics, research, and support services to more than 500 community health care sites, reaching nearly 6 million patients. We partner, learn, innovate, and advocate to close gaps in health care that are systemic, avoidable, and unjust, so everyone has a fair opportunity to achieve their full health potential. Supplemental Figure 1 shows the geographical distribution of CHCs in the OCHIN network. Member clinics are found across the United States, with a large concentration on the west coast, midwest, and the northeast. Learn more at www.ochin.org.
Supplemental Figure 1. OCHIN Member Map

The data in this report uses information pulled from the electronic health records of the CHCs in the network; all data were de-identified and aggregated to protect patient privacy. Research utilizing the aggregated data was reviewed as an exempted protocol by the WIRB.
Measuring Race and Ethnicity
As described in this analysis, race and ethnicity are critical factors in understanding the progression of the COVID-19 pandemic in the United States. Importantly, providers are required to collect standardized race and ethnicity measures as part of their record keeping process. Race and ethnicity are collected on the medical record using the standard requirement set out by HRSA. This includes the following designations used specifically for this analysis:
Race
White, Black or African American, and other/unknown (which includes OMB definitions for American Indian or Alaska Native, Asian, and Native Hawaiian or other Pacific Islander). Note that small cell sizes precluded us from analyzing or reporting further detail in our “other/unknown” category.
Ethnicity
Ethnicity, defined in this analysis as either Hispanic or non-Hispanic/unknown where Hispanic includes persons of Cuban, Mexican, Puerto Rican, South or Central American, or other Spanish culture or origin, and Hispanics born in the United States; these do not include persons from Portugal, Brazil, or Haiti whose ethnicity is not tied to the Spanish language.
Patients were identified as either Hispanic or on-Hispanic/unknown, and among those not identified as Hispanic, we identified patients by reported race as described above (e.g. non-Hispanic, white).
Measuring COVID-19 Positivity
Our definition of COVID positive includes an algorithm to list patients with a positive COVID-19 diagnosis or screening test result. Positivity rate is calculated using total visits to OCHIN sites as the denominator.
Note that the definition of COVID positive may vary from one study to the next or from a given government source, and is largely dependent on the data available to the researcher. For example, while a claims-based analysis would need to rely on an ICD-10 diagnosis of COVID, many EHR-based analyses may rely on the availability of COVID positive test results to determine inclusion in the study population. Furthermore, tests are delineated between type: PCR and antibody. Generally, whereas PCR tests would measure current infection, antibody tests results measure whether someone was previously infected. Given the timing and availability of tests, particularly in the early months of the pandemic where tests were not widely available, and give this analysis’ attempt to examine variation in infection over time, we chose a COVID-19 definition that was more permissive.