Earlier HCCI research found that at the national level, commercial payers paid prices that were, on average, 122% of Medicare. However, we found that commercial professional service prices varied dramatically across states from 98% of Medicare in Alabama to 188% of Medicare in Wisconsin. There was similar variation within states, such as California, and also substantial variation within Metro Areas across types of providers and services. Health care is notable for the heterogeneity of providers that can provide a wide range/certain services. Many professional services can be provided by primary care providers, cardiologists, nephrologists, or any one of a number of other specialties or sub-specialties. As a result, policies that benchmark commercial prices to Medicare prices may disproportionately affect different specialties. For example, if commercial prices relative to Medicare differed for clinically or administratively similar services, any policy that tied commercial rates to Medicare rates also could lead to distortions in utilization. For example, if the commercial price relative to the Medicare price for an 15 minute established patient office visit is higher than for a 25 minute established patient office visit, a policy to tie rates to Medicare could lead to a change in practice pattern such that 25 minute established patient office visits would increase.
In order to assess if payments for the same services differed according to the type of physician specialty we compared the average commercial prices paid relative to Medicare for a basket of professional services provided by Primary Care providers (PCPs) to the same for all other types of providers (Non-PCPs) in 2017. To do this, we mapped each professional service claim to a single provider and then categorized those providers as either PCPs or Non-PCPs following Reiff et al. (2019).1
Figure 1 plots the average commercial professional service price relative to Medicare for services provided by PCPs and Non-PCPs for a sample set of metro areas. In some areas, such as Dayton, OH, and Denver, CO, we observe little difference in the commercial professional service prices as a percentage of Medicare by specialty type. In some metros, there was a much wider range. For example, in Sacramento, CA the average service price for PCPs was 187% of Medicare rates compared to the average price for Non-PCPs of 150% of Medicare.
We do not find that either PCPs or Non-PCPs consistently have higher commercial prices as a percentage of Medicare. In some metro areas, PCPs had higher price relative to Medicare than Non-PCPs. For example, commercial prices averaged 114% of Medicare among PCPs in Lakeland, FL, and 108% of Medicare among Non-PCPs. Similarly, in Charlotte, NC, commercial prices for PCPs were 151% of Medicare while they were 138% for Non-PCPs. On the other hand, in places like Boulder, CO, (121% of Medicare for PCPs and 125% for Non-PCPs) and Nashville, TN, (124% of Medicare for PCPs and 134% for Non-PCPs) PCPs had lower prices relative to Medicare than Non-PCPs. You can use the search bar in Figure 5 below to see how commercial prices for PCPs and Non-PCPs compared to Medicare rates in your metro area of interest.
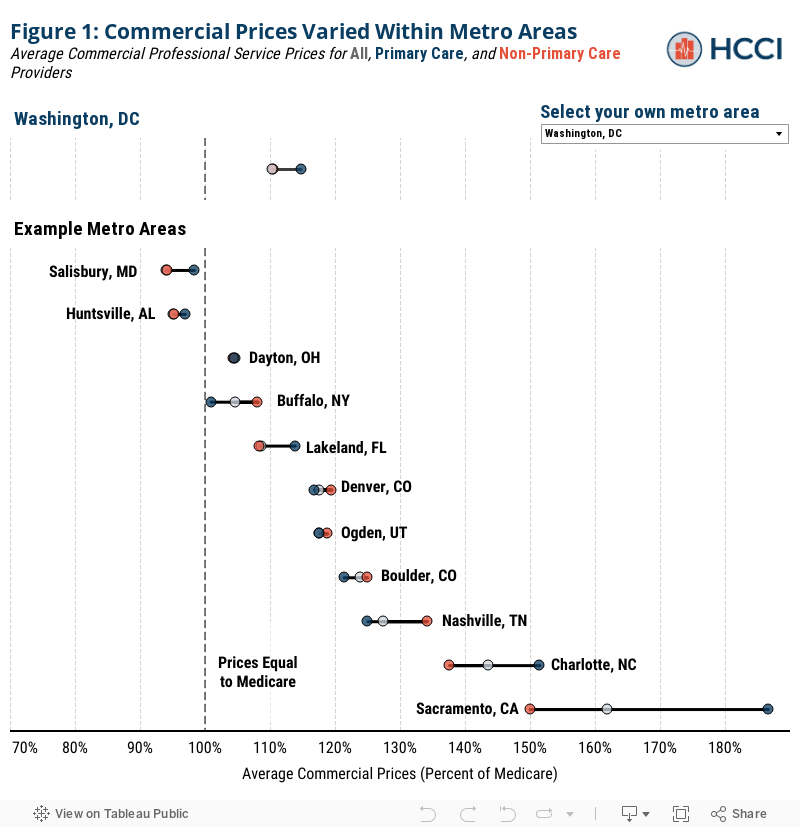
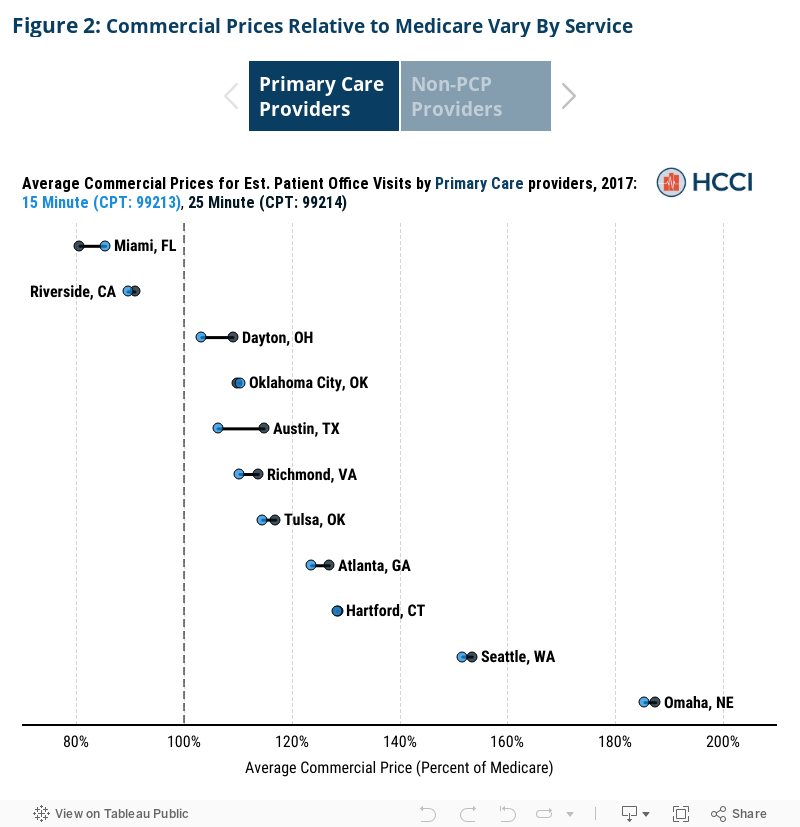
Figure 2 plots the average commercial price relative to Medicare rates for two common services: 15-minute established patient office visit (CPT: 99213) and the 25-minute established patient office visit (CPT: 99214). Generally, we do not find substantial differences in commercial rates as a percentage of Medicare for these seemingly similar services, provided by primary care providers in the same metro area. The median difference among these services provided by PCPs was 2 percentage points. While beyond the scope of this report, this comparison is among two highly similar services. It is likely that there is larger variation across more distinct services.
In some metro areas, however, there was a larger discrepancy in commercial prices relative to Medicare rates even among these two office visits. For example, in Austin, TX the average commercial price for a 25-minute office visit with a primary care provider was 115% of Medicare whereas a 15-minute office visit was 106% of Medicare – a difference of almost 10 percentage points. In metro areas like Memphis, TN, commercial prices relative to Medicare for these two services were similar. We observe similar patterns among Non-PCPs as well as PCPs. Use the toggle below to see how office visit prices for select metro areas varied among both PCPs and Non-PCPs.
Even among very similar services, we observe differences in commercial prices relative to Medicare within metro areas. These examples highlight the fact that potential policies aimed at benchmarking commercial rates to Medicare may have a differential impact even within the same metropolitan area. For example, in a metro area with wide variation in the average commercial prices relative to Medicare between PCPs and Non-PCPs, like Sacramento, CA, the policy to cap commercial prices at 150% of Medicare (described above) would have differential financial impacts on different types of providers. Similarly, in metro areas where commercial rates as a percentage of Medicare vary by service, such as Austin, TX, a policy to cap commercial prices at a percentage of Medicare may change the financial calculus of providing particular services. This could either affect provider offices differentially based on their practice patterns or even incentivize a shift in which services offices perform – potentially undermining the impact of benchmarking Medicare rates.
For a complete discussion of this report’s limitations please see the limitations section of our related report.
Endnotes
1Reiff, Julie, Niall Brennan, and Jean Fuglesten Biniek. “Primary Care Spending in the Commercially Insured Population.” JAMA 322, no. 22 (December 10, 2019): 2244–45. https://doi.org/10.1001/jama.2019.16058.