
The staggering death toll of the novel coronavirus pandemic in the United States has been widely reported, surpassing 523,000 as of March 8, 2021. Over the course of the current pandemic a common method for measuring the probable number of deaths caused by COVID-19 has been comparing actual deaths in 2020 to the expected number of deaths in 2020 based on deaths in previous years.
To add to the growing body of work that seeks to understand how COVID-19 has impacted our communities, we have created an aggregated death dataset based on obituary data sourced from online newspapers, funeral homes, online memorials, direct submissions and more made available through the Datavant ecosystem. This work builds on and corroborates the findings reported by the National Center for Health Statistics and the CDC, which use preliminary data based on death certificates. Both the work presented here and that reported by NCHS/CDC (and by extension The New York Times and The Washington Post) use “real-time data” – data that are still being collected and updated as we analyze and report estimates. Since real-time data may fluctuate more than historic data, it is crucial to continuously verify the results. The work we present here and in the accompanying downloadable data files collects death information from obituaries rather than death certificates. Despite using a different primary source of death data, we find similar results to CDC estimates of excess deaths, which supports both our findings and theirs. We hope that this analysis serves as a research resource to those seeking to better understand the effect of COVID-19 on all-cause mortality.
We will update this tool every week to include the most recent data available and any additional analyses we perform on the data. The underlying obituary data are updated weekly; however, it takes approximately four weeks for near-complete reporting of deaths.
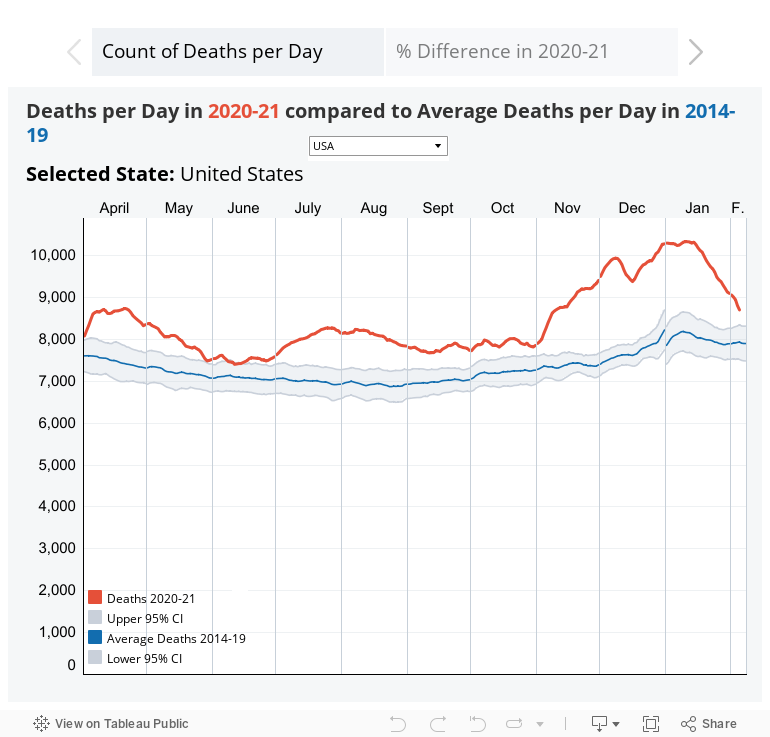
In the interactive figure below, we show the count of deaths on each day and the average number and 95 percent confidence interval of deaths on that date for 2014-2019. Estimates are reported at the national and state level and for New York City. You can use the drop-down filter in the figure to select the area of interest.
Using obituary data, we found that from April 4th to May 16th, daily deaths in the United States were over 10% higher than in previous years, with a peak on April 21st when daily deaths were 17% higher. New York City, widely held as the epicenter of the pandemic in the United States, experienced more than double the typical daily deaths every day between March 26th and May 2nd, peaking on April 5th when number of deaths was four-times the average of previous years.
By mid-April, we begin to observe a decline in daily deaths in some states including New York, New Jersey, Connecticut, Massachusetts, and Pennsylvania. Daily deaths continued to rise or plateau throughout April, May, and June in other states such as Louisiana, Mississippi, and Georgia. In June we see a rise in daily deaths in Texas, Arizona, Alabama, and Arkansas. The June trends continued into July with additional states seeing daily deaths increase including Florida and South Carolina We will continue to monitor these trends and many others as the data is updated each week.
Starting July 4th, the daily deaths in the United States in 2020 were once again over 10% higher than expected. On July 17th, daily deaths were over 15% higher than previous years for the first time since April 25th. From mid-August to the end of October daily deaths declined, but started increasing again in November. On December 7, 2020 average daily deaths hit a new peak with deaths 31% higher than expected.
Previous versions of the downloadable data are available on our Research Resources page.
Methods Note
We looked at a 7-day (date +/-3 days) moving average of daily deaths in the United States for 2020. To compare deaths in excess of historic levels, we built a 95 percent confidence interval around the mean moving average of daily death for years 2014 through 2019; we excluded 2018 in our historical estimates due to questions about the validity of the date of death in that year. The month and year of death were known for all individuals included; for some observations exact date of death was unknown. Deaths with unknown date were distributed equally across days of the month death occurred. Due to the low number of daily deaths in Alaska, the state has been excluded from this analysis.
The current iteration of this tool does not weight the data to compensate for population-level age discrepancies in mortality; it compares only unweighted 2020 deaths to an average unweighted historical count of deaths. Furthermore, we cannot distinguish the cause of death from the obituary data, and present only all-cause mortality. Geographic information includes city and state data from the obituary record.
While the data are updated weekly, there is an approximately four-week lag in the accumulation of sufficient data for reporting. We therefore show only data reported as of this week for deaths occurring in the prior three weeks. Also note that as new data become available, figures previously reported may be updated to reflect new information.
We sourced death counts from a dataset made accessible and linked by Datavant, which accounts for 80%+ US deaths, sourced from obituary data from online newspapers, funeral homes, online memorials, direct submissions and more. We compared death counts estimated from these obituary records with the preliminary Weekly Counts of Deaths by State dataset published by the National Center for Health Statistics (NCHS). The NCHS data is based on death certificate data and is updated weekly. We compared the total count of deaths from all causes by state and week. The death data based on obituaries represents over 80% of the weekly deaths reported in the NCHS data after four weeks of data completion and over 90% after eight weeks of run-out. While numbers were closely aligned, there were some geographic differences in the number of deaths reported – when using obituary data some states had fewer than 80% of the deaths reported in NCHS. We also observed some states with higher death counts based on obituary data.