
The United States Congress passed the No Surprises Act last year, offering several protections to consumers. Beginning in 2022, providers can no longer bill patients for more than their insurance’s in-network cost sharing. The law also bans balance billing except in situations where a patient is notified in advance and their written consent is obtained. Independent dispute resolution between insurers and providers is allowed for any surprise medical bill.
Unexpected medical bills, sometimes totaling tens of thousands of dollars, can appear following any medical procedure. These experiences have been well-documented in high-profile media stories, and there is a growing body of research studying this phenomenon. The Health Care Cost Institute (HCCI) has shown that one in seven in-network inpatient admissions had an associated out-of-network claim in 2016. Out-of-network bills are most commonly associated with emergency department, anesthesia, pathology/lab, and radiology services.
Following enactment of the No Surprises Act, the Biden Administration has important policy decisions to make that will shape how well the law will protect consumers from surprise medical bills. For example, the Administration must establish the qualifying payment amount (QPA) through regulations published by July 1, 2021. The definitions and methods codified in those regulations will have very real effects on the legislation’s outcomes.
The QPA, generally, is the median of an insurer’s contracted rates for a particular service in a particular geography for a particular market (e.g., individual, small group, or large group). Under the No Surprises Act, the QPA will be used to determine the amount patients will have to pay for out-of-network services. Additionally, it will play a significant role in the arbitration process through which health insurers and providers negotiate what the providers will be paid for a given service. This means that both the amount patients must pay for an out-of-network service and the amount that providers are reimbursed for that service are affected by the QPA.
In establishing the QPA and/or the methodology to calculate it, the Administration must determine how median in-network allowed amounts will be set. Because these median amounts will be used in arbitration as well as in setting patient cost-sharing expectations, it is crucial that HHS chooses its methodology carefully: the median in-network allowed amount depends on where you are and how you define it.
HCCI has conducted extensive research on out-of-network costs and surprise billing, and this blog seeks to summarize our findings within the context of the QPA. Our unique dataset allows important insights into the commercially-insured population that can help inform the policy parameters of defining the QPA and increase understanding of the potential impacts of different inputs and definitions in determining the QPA.
Determining QPA Based on Geographic Area
The median price for a given health care service varied dramatically based on where the service was provided for each code and for each service studied. This geographic variation in median price means that two people receiving the same service in different locations could pay vastly different cost sharing amounts. It also means that a provider in one state or metropolitan area could be paid a different amount than a provider offering the same service in another area. Because the QPA is linked to median prices, how the Administration determines the calculation of the QPA will have differential impacts both on provider payments and patient copays for services covered under the No Surprises Act.
HCCI’s earlier research examined allowed amounts (the total payment made by insurers and patients), calculated the mean and median in-network rates, as well as the ratio of the commercial ESI to Medicare fee-for-service mean allowed amounts. Only providers with a specialty that matched the service category (for example, anesthesiology services provided by anesthesiologists) were included. We did not include facility fees or amounts for ancillary services. Below, we discuss how that analysis affects decisions about how to set the QPA.
Variation in Median Prices by Geographic Area
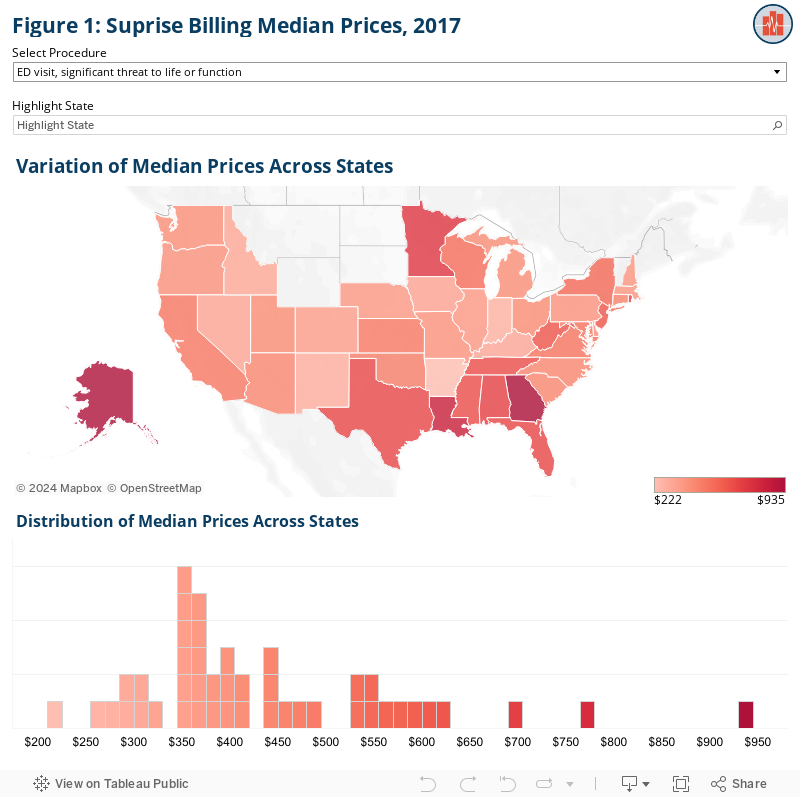
Previous HCCI research documented significant variation in median prices both across and within states, and in urban versus rural areas. As shown in Figure 1, when looking across states, we consistently observed 3- to 4-fold differences between lowest median price and the highest. For example, the median allowed amount for anesthesia for a Caesarian delivery ranged from $517 in Pennsylvania to $1,672 in New York. For a high severity emergency department visit (the most commonly billed emergency department code), the median allowed amount in Alaska ($625) was more than four times the amount in Arkansas ($151). This four-fold differential was true for the three most serious emergency department visit codes. For the least serious emergency department code we report, the highest allowed amount was 2.5 times as much as the lowest.
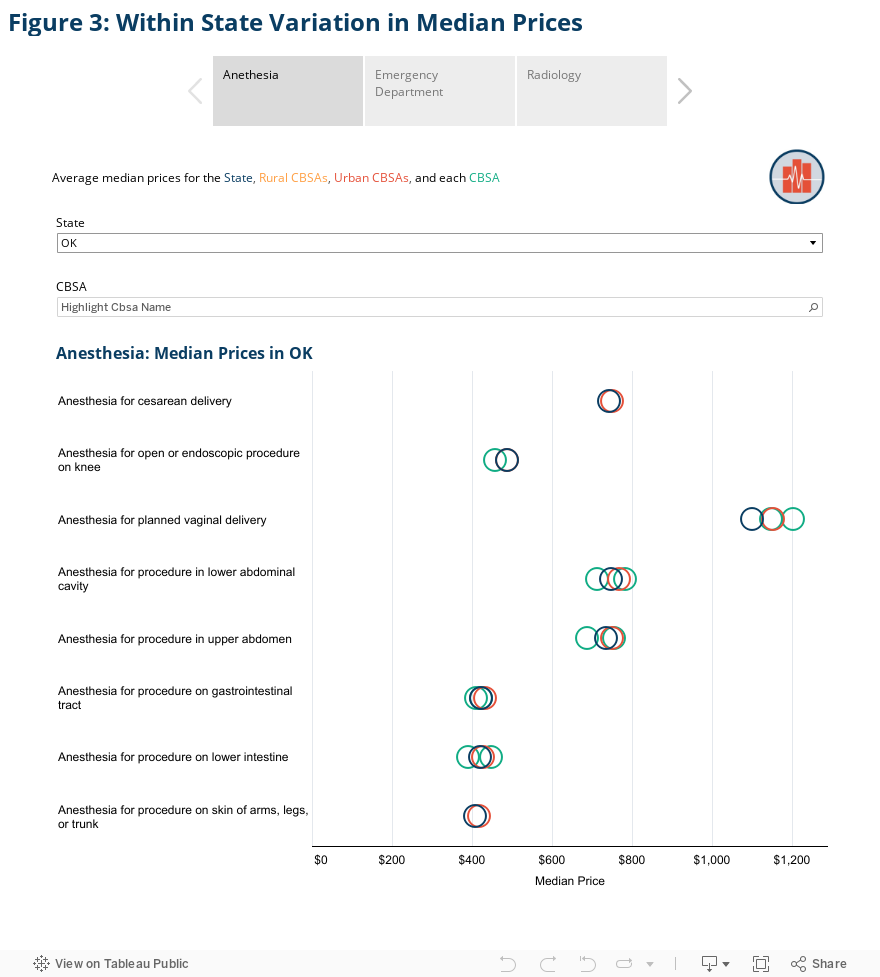
There is even greater variation across metropolitan areas, which we illustrate in Figures 2 and 3. Overall, the median allowed amount for anesthesia for a Caesarian delivery ranged from $527 in Detroit, Michigan, to $1,850 in Orlando, Florida. Similarly, the median allowed amount for an emergency department visit for a problem with high severity in Corpus Christi, Texas, ($959) was more than eight times the amount in Erie, Pennsylvania ($116).
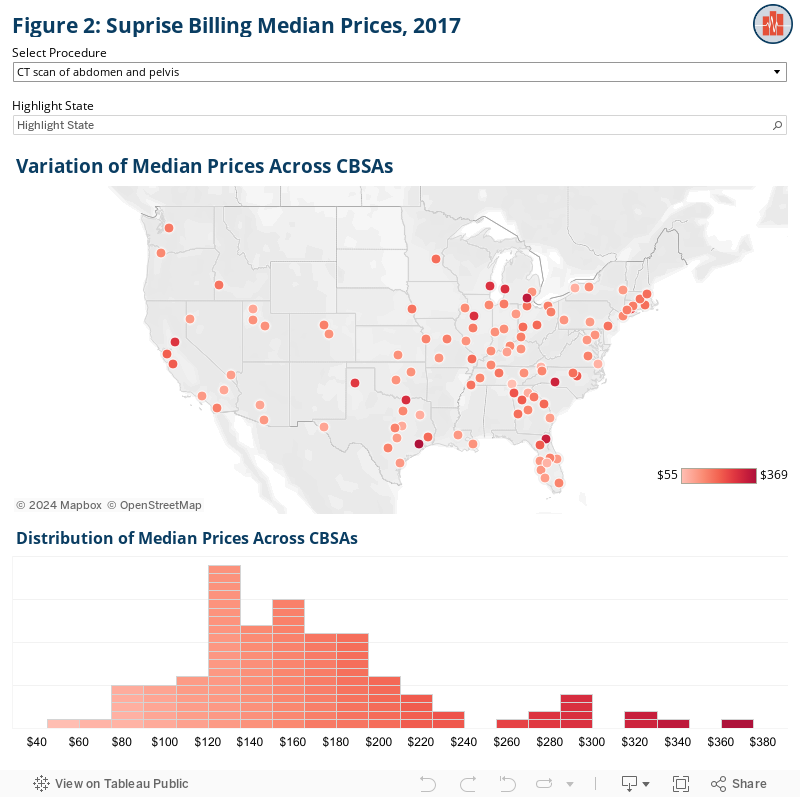
We observe variation among metro areas even within the same state. In the state of Florida, for example, the median allowed amount for that same high-severity emergency department visit was nearly $400. Within the state, that amount ranged from $185 in Cape Coral to $913 in Crestview. In Georgia, the statewide median for the same code was $482 but ranged from $140 in Albany to $861 in Athens. The median commercial rate across Missouri was $229 with a low of $169 in Columbia to a high of more than twice that amount in St. Louis ($414).
Urban and Rural Area Differences
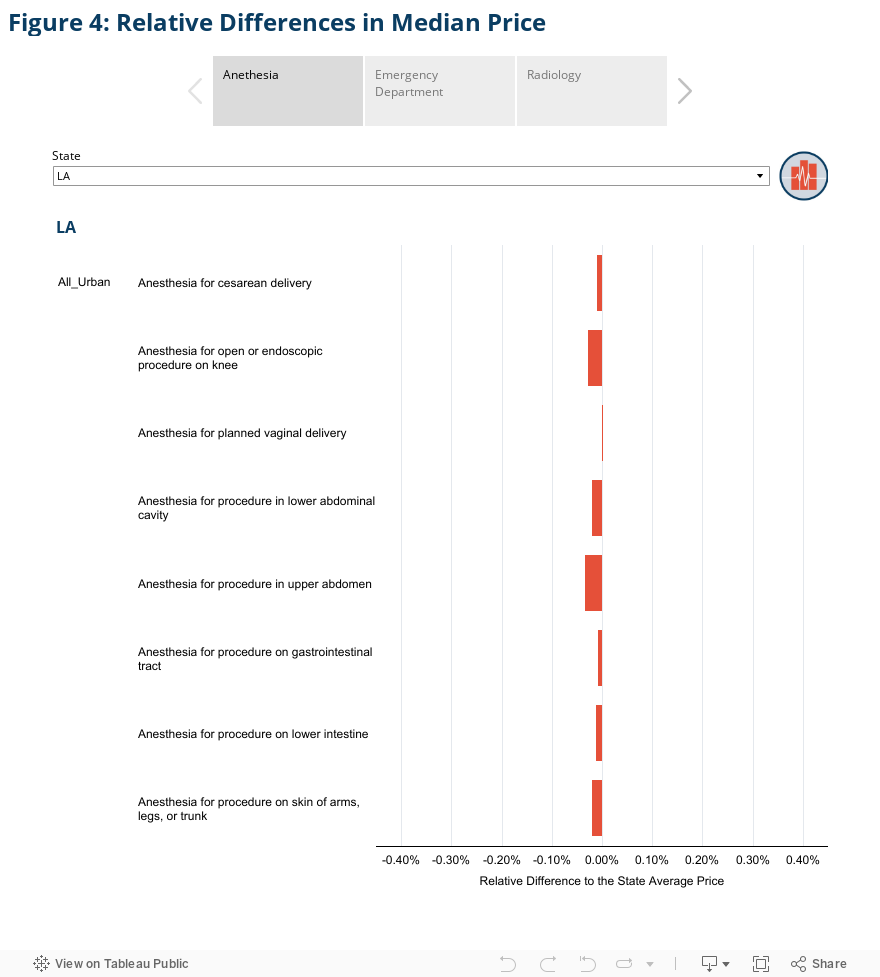
Figure 4 illustrates the relative difference between median price calculated at the urban substate or rural substate level and the median price calculated at the state level for select services. It demonstrates that differences between urban, rural, and statewide medians depend on the state and service.
In Texas, for example, median rates for radiology procedures were always higher in rural areas. The median allowed amount for a CT scan of the head or brain in Texas was $79 statewide and in Texas’s urban areas. In rural Texas, the median amount was $164, more than double that amount. Similarly, the median allowed amount for an abdominal ultrasound in rural areas averaged $105 in Texas’s rural areas, nearly twice as much as the average of $53 in urban areas. The statewide median allowed amount for that same service was $55.
In contrast, median rates for emergency department procedures in New York State were always higher in urban areas. For example, the median allowed amount for a life-threatening emergency department visit in New York’s urban areas was $485, slightly more than 50% higher than the State’s rural areas where the median allowed amount was $300.
As shown in Figure 4, of all the services we studied, there was a difference between the statewide median amount and the urban or rural median amount about 60% of the time. The relative difference between the state medians and substate medians could also be quite sizable. For instance, in Texas, anesthesia during a planned vaginal delivery was more than 2.5 times more expensive statewide ($1,700) than it was in rural areas within the state ($648). Conversely, in Louisiana, a moderately severe emergency department visit was more than 3 times more expensive in rural areas ($395) than the state average ($129).
Potential Impacts Related to QPA definitions
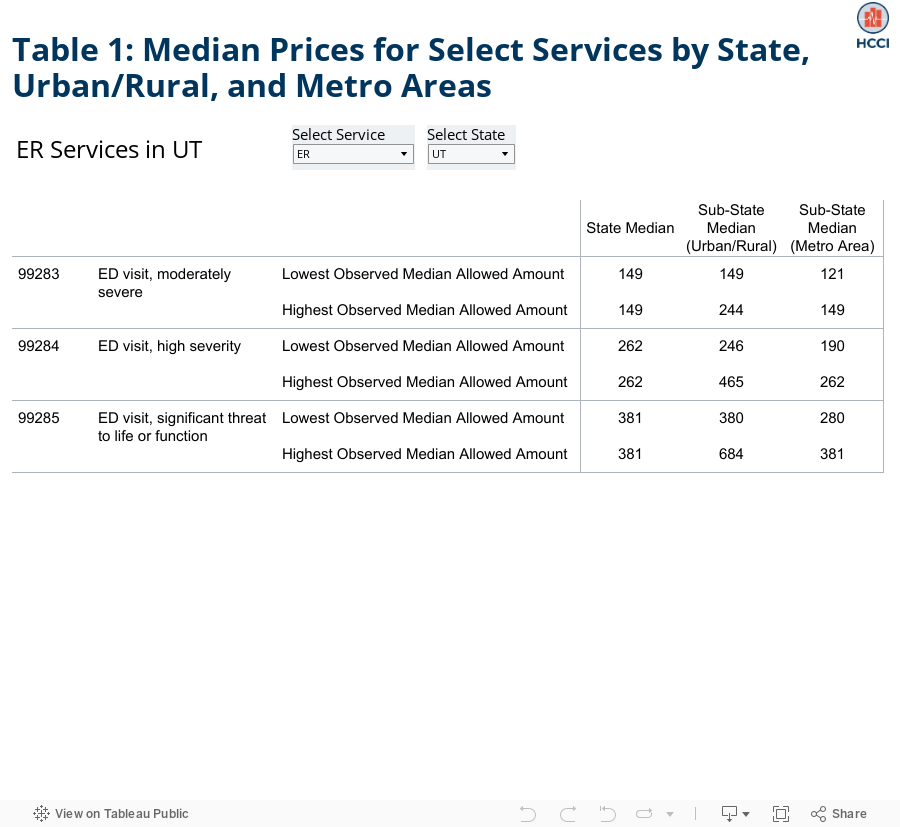
Patients and families will bear very different financial burdens depending on which geographic region policymakers use in determining the QPA. For example, in Utah, the QPA amount for a high severity emergency department visit could range from $190 to $465 depending on the choice of geography for determining the QPA. (See Table 1.)
Looking across possible geographic bases for defining the median price, the differences described above will translate to patients’ wallets. For example, assuming the median is calculated based on individual codes, a birthing person in Ohio with 20% coinsurance who has anesthesia for her C-section delivery could pay anywhere from $117 to $219 depending on the parameters of the regulation:
- $173 if the median allowed amount for Ohio is used
- $177 if the median allowed amount for urban areas in Ohio is used
- $117 if she lives in Cleveland, and the median is calculated based on metropolitan areas
- $219 if she lives in Columbus, and the median is calculated based on metropolitan areas.
All those possibilities (and more) exist for the same person, for the same service. That individual impact, with its very real implications for that family, is multiplied for each service on each out-of-network bill across the country.
The Administration may also be considering other geographic subdivisions, such as counties or rating areas for qualified health plans. We anticipate that the variation we observe in the three areas above (state, metro area, and urban/rural) is reflective of variation that will occur with any chosen geography.
Determining QPA for a Specific Service
In addition to choosing which geography to use to determine the median amounts, regulators must also prescribe the methodology for determining the median rate for a given service. Although it may seem simple, the median rate for a particular service will depend on how “median” is defined. HCCI’s earlier analysis allows us to consider three possibilities: 1) Median of all individual claims paid for a particular CPT code; 2) Median by type of service without accounting for how frequently that service is billed; and 3) Median by type of service accounting for how frequently that service is billed.
Median of all individual claims paid for a particular CPT code
In this situation, the median rate would be determined by arraying the allowed amounts for a given CPT code across health plans in a particular area (e.g. state or metro area). For example, the amount that each plan reimburses emergency departments for a visit for a high severity problem (code 99284) would yield a median amount for a given geographic area. That amount would be the QPA for that code, and a person’s cost sharing and emergency department’s reimbursement would be determined by that amount. Using Nashville, TN, as an example, the median amounts for emergency department CPT codes calculated this way appear in the first column of Table 2 below.
Median by type of service without accounting for how frequently that service is billed
If, instead, policymakers establish a QPA for a type of service (e.g. for emergency department services instead of each individual emergency department code), they would need to combine the median prices for all codes within that type of service in some way. Most simply, regulators could establish a median price for each code within a service type by counting each of those medians as one observation and then calculate the median of those medians. Continuing the emergency department example, a median rate would be determined for each CPT code and then the median of those rates would be calculated. In this case, each code would count only once. The four codes would be arrayed as in the first column of Table 2, and the median amount for emergency department services in Nashville, TN, would be $197.
This change in the definition of the median rate would lead to higher cost sharing for patients with a lower-severity emergency department visit and lower cost sharing for those with a higher severity visit. (With the same phenomenon applying to reimbursement rates to emergency departments.) For a person in Nashville with a life-threatening trip to the emergency department, using type of service to define the median would mean cost sharing based on a price that is nearly half of the CPT-specific definition. See Table 2 below for a comparison of median amounts for emergency department visits in Nashville, TN.
Median by type of service accounting for service frequency
The median price for a given type of service could be affected by how frequently codes within that service type are used. If, within a type of service, lower price codes are billed more frequently than higher priced codes, the median will be lower than if all codes were billed equally. The inverse also is true. Therefore, regulators need to decide whether the median rate for a particular service type will account for how frequently codes within the type of service are billed. Using emergency department visits as an example, earlier HCCI research shows that higher-priced codes are billed more frequently. This means that the median price accounting for how frequently codes are billed will be higher, in a given geographic area, than the median price not accounting for how frequently codes are used. See Table 2 for the emergency department example in Nashville, TN.
If the median took into account how frequently each code is billed, every claim for an emergency department visit would be included in the calculation. HCCI’s earlier analysis shows that the 50th percentile emergency department visit is most likely a 99284 code. That means that the median CPT code among all emergency department services taking into account how frequently each code is billed would be 99284’s allowed amount. In our previous Nashville example, the median allowed amount for an emergency department visit would be nearly $250. As shown in Table 2, for the patient with a life-threatening emergency department visit, defining median for a type of service in a way that accounts for how frequently a code is used means cost sharing based on a price that is about 25% higher than median by type of service without accounting for volume. Compared to a CPT-specific median, the price is about 30% lower with cost sharing similarly lower.
Table 2. Median Allowed Amounts per Code, by Type of Service (not accounting for frequency), by Type of Service (accounting for frequency)
| MEDIAN AMOUNT | ||||
| Code | Description | By Code | By Type of Service (Not accounting for frequency) | By Type of Service (Accounting for frequency) |
| 99282 | Emergency department visit, low to moderately severe problem | $97 | $197 | $249 |
| 99283 | Emergency department visit, moderately severe problem | $145 | $197 | $249 |
| 99284 | Emergency department visit, problem of high severity | $249 | $197 | $249 |
| 99285 | Emergency department visit, problem with significant threat to life or function | $363 | $197 | $249 |
The three approaches to calculating median prices shown in Table 2 illustrate how different patients’ out-of-pocket payments (and providers’ reimbursement) could be. For example, if policymakers determine the median of each individual emergency department code, a person in Nashville would pay a percentage of $97 for a low-severity emergency room service, and a percentage of $363 for a life-threatening emergency department service. If, instead, regulators calculate the median accounting for how frequently emergency department codes are billed, that patient would pay a percentage of $249 for any emergency department service.
A similar dynamic exists for providers. If policymakers calculate the median for each individual code, a provider would be reimbursed higher amounts for more severe emergency department services. If, instead, the median is determined accounting for frequency, the provider will receive the same reimbursement for any emergency department service, regardless of severity. Policymakers may want to consider whether the selected methodology creates incentives for providers to change either their practice or billing patterns.
Conclusion
The factors we discuss in this blog – geographic area and calculation of median amount – touch on just two of the factors the Administration must consider in determining the QPA. Because the QPA is central to what patients and families will pay out of their own pockets for services and what insurance companies will pay providers of care, there are real-world consequences to how the QPA is calculated. Both patients and providers have a lot at stake in the upcoming regulations.
All of HCCI’s research on out-of-network billing, including downloadable public use files and data visualizations, can be found here.
Methods
This analysis includes only previously published numbers based on HCCI’s “1.0” dataset. Estimates for the employer sponsor insured (ESI) population are based on 2017 claims data from the Health Care Cost Institute. All costs represent only in-network professional fees – amounts paid to providers participating in payer’s network; they do not include facility fees or out-of-network professional fees. ESI data were restricted to claims where service category and provider specialty were aligned – anesthesia provided by anesthesiologists, radiology provided by radiologist, ER services provided by emergency medicine specialists. ESI data were further restricted by place of service and only include professional services performed in inpatient hospitals, outpatient hospital departments (on or off campus) and emergency departments. CBSA is based on provider address. Data were suppressed according to HCCI masking rules based on the number of procedures performed at a given level of reporting.