
In a recent issue brief, HCCI found that the already high cost of care for people with multiple sclerosis (MS) rose dramatically over the past several years. The primary driver was the increasing cost of a small group of prescription drugs called Disease Modifying Therapies (DMTs). To illustrate the role prescription drug prices play in driving overall health care spending for people with MS, we developed an interactive tool that allows users to compare changes in prices and spending for specific DMTs.
Spending for the average person with MS grew 66% from $23,890 in 2009 to $39,628 in 2015, and DMTs accounted for 82% of this increase. Per person spending on DMTs more than doubled from 2009 to 2015, even as use of DMTs per person decreased slightly over the same period. Despite the introduction of new, oral DMT options, the price of every single DMT increased by at least 9% per year between 2009 and 2015.
Our interactive tool allows you to compare changes in prices between specific DMTs. For example, some notable DMT price trends include:
- Price increases were consistent for both new oral DMTs that came to market during the study period and older treatments.
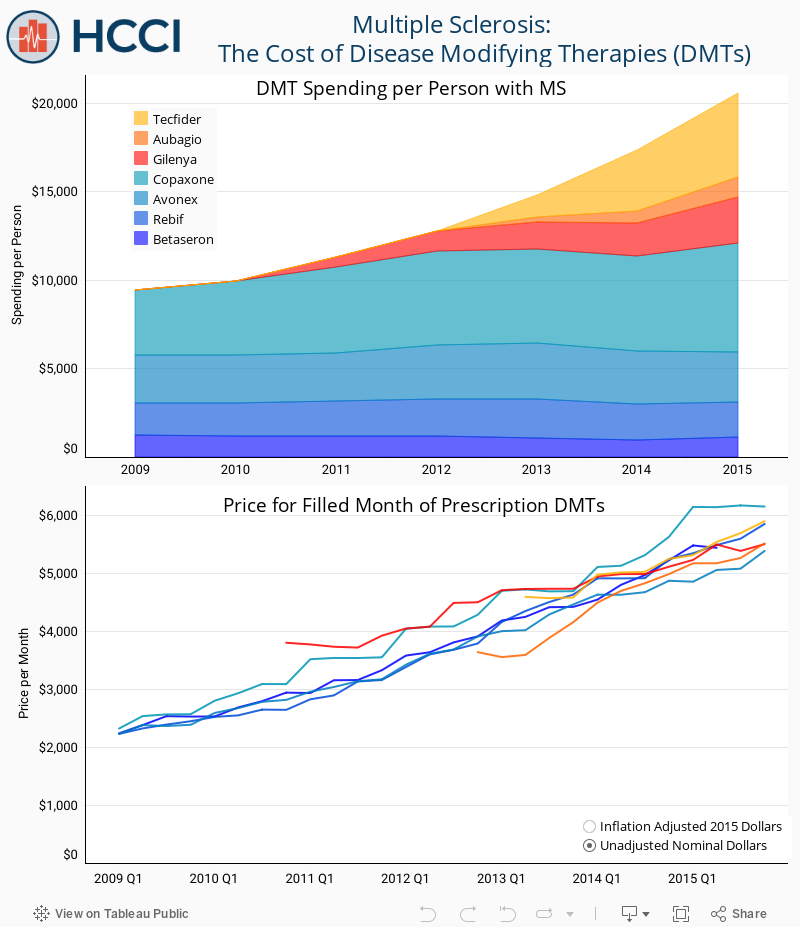
- The cost of a month’s supply of Copaxone, a treatment launched in 1997, increased by 164% from 2009 to 2015 from $2,326 to $6,151.
- The rate of price increases for a month’s supply was similar across older, injectable DMTs, ranging from 24% per year for Avonex to 27% per year for Copaxone.
How to use the tool:
The top panel of the graph shows the total per person spending on DMTs for people with MS, demonstrating the rise from 2009 to 2015. The bottom panel tracks the average cost – or price – of a month’s supply for each DMT. Spending and price of individual drugs can be highlighted using the legend or clicking the chart. The trends of DMT prices can also be adjusted for inflation using the buttons located in the bottom right corner.
All the data used to construct these charts can be downloaded here.
End Notes
[i] We defined metro areas as Core Based Statistical Areas (CBSAs), as identified by the Office of Management and Budget, to define our metro areas.
[ii] For more information about the Healthy Marketplace Index project, the data we used, and our methods please see our website.
[iii] Price levels compare the prices of metro areas to the national average within one year, in this case 2016. Growth rates compare the price level of the same CBSA over time; most often we report the growth rate between the first and last year of our study (2012 and 2016).
[iv] We calculated inflation using the annual average CPI-U from 2012 (229.594) to July 2016 (240.007). Available online.
[v] Inpatient services are rendered to patients who are kept in a health care facility overnight for treatment but not for observation. Outpatient services are rendered to patients by sections of a hospital that provide medical services not requiring an overnight stay or hospitalization (e.g., emergency room [ER], outpatient surgery, observation room). Professional services are rendered to patients by a health care professional. Service claims with no valid revenue code are assumed to be professional services (e.g., office and preventative visits, administered drugs).