Increasingly, policymakers are considering proposals that tie payments made by private health insurers, in some way, to rates paid by Medicare. These proposals are inspired by the rising cost of health care and widespread variation in health care prices. For example, we recently found that the cost of the same service can vary by 5-fold, 10-fold or more within the same market among the commercially insured. While these proposals sound intuitively appealing, significantly more work needs to be done to understand how these proposals could be implemented in our health care system. The calculations of Medicare payment rates have become more and more complicated due to the impacts of legislation and multiple policy approaches.
Recently, the Health Care Cost Institute (HCCI) analyzed the negotiated rates paid by commercial payers for professional services and compared them to rates set by Medicare for the same services. In that analysis, we defined Medicare rates according to what was listed in the appropriate Physician Fee Schedule (PFS) published by CMS annually. While the primary goal of our original analysis was to document differences in commercial versus Medicare rates, we also discovered that the actual Medicare payments providers received did not match the published rates in the PFS.
In this study, we wanted to confirm the gap between FFS payments and PFS rates we had observed earlier and to try to identify the factors that explain the difference. By understanding how PFS rates are modified to result in the FFS payments, decisionmakers can see the impact of payment and other policy decisions on what providers are paid. Policymakers considering proposals that link private health insurance rates to Medicare rates will need to be aware of these implications as they make decisions about how to shape those proposals.
We found that FFS payments were consistently lower than PFS rates. In fact, aggregated FFS payments for professional services were nearly $4 billion (approximately 6%) lower than the amount we calculated based on the PFS before any adjustments to payments ($57.3 billion compared to $61.2 billion, respectively). This pattern of FFS payments being lower than PFS rates persisted when we looked at the weighted average price for a standardized basket of common professional services.
In this paper, we first walk through a comparison between FFS payments on PFS rates on average for a basket of professional services commonly used among the privately insured and Medicare populations. We then assess the effect of known adjustments to PFS rates to identify what is contributing to the difference we observe between FFS payments and PFS rates. The differences between the PFS rates and what Medicare actually reimbursed were primarily the result of policy choices made over time (e.g., across-the-board payment reductions enacted in 2011) as well as how some payments to providers have been operationalized (e.g., some incentive programs apply penalties through FFS but pay bonuses as lump sums outside the FFS payment system).
Measuring Prices and Payments
For this analysis, we measured Medicare rates and payments using two different sources: the published Medicare PFS rates for 2017 and the payments made by the Medicare FFS program using 2017 claims data.
Measuring Medicare Service Prices using the PFS
CMS annually publishes a complete listing of rates used to pay doctors, other providers and suppliers known as the PFS. CMS develops fee schedules for several different services which include physicians’, ambulance services, clinical laboratory services, and durable medical equipment, prosthetics, orthotics, and supplies. We focus on payment rates to physicians, specifically services classified as Evaluation & Management and Procedures, excluding anesthesia and dialysis procedures. In the PFS, payment rates for services are weighted based on the clinical work involved for each service. CMS also factors in price components for physician wages, wages of clinical and administrative staff, costs of contracted services (e.g., accounting and advertising), office rent, equipment and supplies, and cost of liability insurance. These input factors are adjusted for geographic location of the rendered service.
Measuring Medicare Service Payments using FFS Claims
We used HCCI’s FFS claims data to determine actual payment amount made by Medicare (FFS payment) for a particular service. To best match the PFS, we only included paid claims where the payment rule year code was 2017, where Medicare was the primary payer, and where the provider agreed to the Medicare rate. We also included Medicare’s Method II Critical Access Hospital (CAH) payments, which are payments made for professional services delivered in a CAH and billed through a separate mechanism than the PFS. While these payments make up a small percentage of professional claims in the Medicare Part B program, they represent a greater portion of spending among rural and underserved areas. We examined the Medicare FFS claims in detail for all geographies (including non-MSAs) and services (including those not in our basket of services), and how they differed from the listed PFS. Our analytic dataset of 2017 Medicare claims data contained just over 543 million distinct professional services from 29 million beneficiaries.1
Medicare reimbursements for professional service claims average less than PFS rates
In 2017, on average, Medicare FFS payments for professional service claims were below the rate published in the PFS. To see this, we looked at the FFS claims for a standardized basket of common professional services across 271 Metropolitan Statistical Areas (MSAs). For each claim, we matched the rate published in the PFS based on the procedure and geography and compared this to the allowed amount on the claim. We then computed a weighted average PFS rate and FFS payment across services in each metro area based on the frequency with which services were performed.
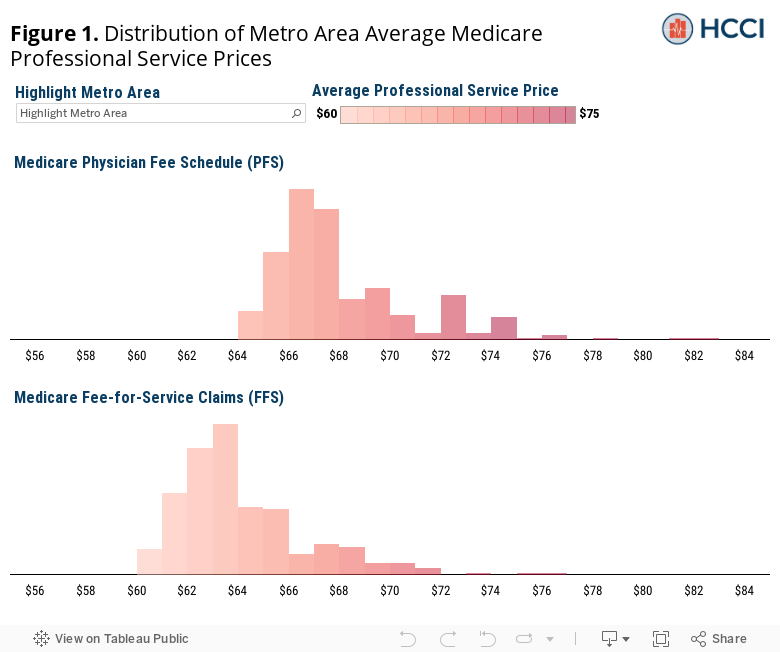
Across metro areas, the average Medicare FFS payment for professional services in the median metro area was $64 compared to the average PFS rate in the median metro, which was $68 (Figure 1). Further, the range of average Medicare FFS payments was lower – ranging from $60 to $77 – than the range of average PFS rates – $64 to $83.
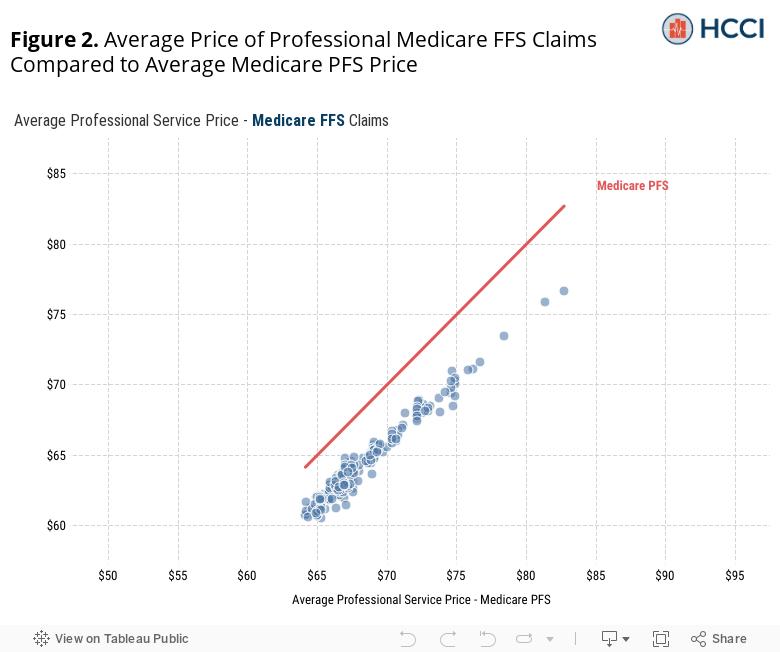
The average FFS payments and PFS rates were highly correlated within MSAs (Figure 2). Areas with higher average PFS rates tended to have higher average FFS payments. We found that there was a persistent wedge of $4 per service (5.6%), on average, across MSAs. Although this difference may seem small, professional services are used so frequently – Medicare beneficiaries used almost 19 professional services per person in 20172 – that the cumulative effect is substantial. For context, a 5.6% increase in average professional service prices for Medicare, all else equal, would have resulted in a $3.3 billion spending increase in 2017.3
Exploring why FFS payments are lower than PFS rates
As noted above, in aggregate, FFS payments for professional services in 2017 totaled $57.3 billion, nearly $4 billion (about 6%) less than what they would have been if the PFS rates had been paid without adjustment. The difference we observe is net of payment reductions and payment increases. Note that because CMS adjusts some payments that are not captured by either the PFS rates or FFS payments, even when penalties are captured on the FFS claims we do not capture bonus payments made from several CMS incentive programs.4
Figure 3 shows FFS payments as a percentage of the published PFS rates, by state.
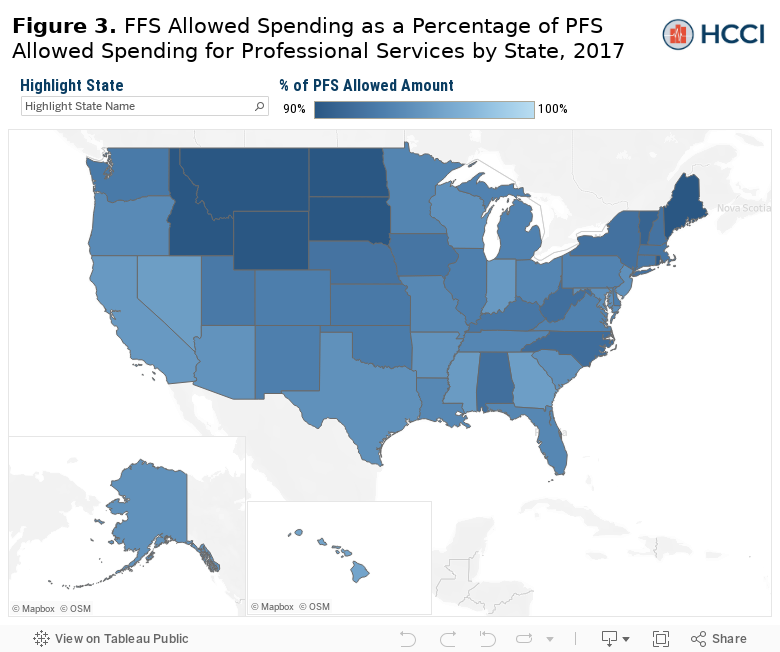
FFS payments ranged from 88% of PFS rates in South Dakota to 95% of PFS rates in Georgia. On the whole, we observe lower FFS payments as a percentage of PFS rates in rural areas (92%) as compared to in non-rural areas5 (94%).
Four broad factors describe the difference between FFS payments and PFS rates
Since we observe a difference between FFS payments and PFS rates in the aggregate and on average for a common basket of services, we wanted to explore what might explain the difference. We identified four main factors: 1) across-the-board cuts to payments for all providers, 2) programs targeted to rural and underserved areas, 3) modifications to payments made based on provider-specific characteristics, and 4) procedure-specific modifications based on the care delivered for certain procedures or during global periods. Below we describe the magnitude of these factors.
1. Across-the-board cuts to payments for all providers
The Budget Control Act of 2011 mandated across-the-board cuts to all government spending programs beginning in 2013. This action, known as budget sequestration, resulted in a 2% reduction in CMS’ payments to providers. From our 2017 analytic dataset, this amounted to a $935 million reduction in payments to providers for professional services.6 Given the across-the-board cuts to payments, there is no geographic variation or provider-type variation in these payment adjustments.
2. Programs targeted to rural and underserved areas
CMS pays higher rates for professional services delivered in a Critical Access Hospital (CAH) and makes bonus payments in areas with a shortage of providers. CMS may pay 115% of the PFS rate for professional services provided at eligible rural hospitals designated as a CAH. Further, CMS also may make a bonus payment of 10% made at the end of the quarter (i.e., these payments are not found on the FFS claim) to providers in Health Professional Shortage Areas (HPSA). HPSA designations are made by the Health Services Resource Administration (HRSA) and indicate areas where there is a health care provider shortage in primary care, dental health or mental health. These programs’ goals are to reduce the financial vulnerability of such providers and ensure access to care for beneficiaries in rural areas.
In our 2017 analytic dataset, these bonus payments amounted to approximately $151 million dollars. Figure 4 shows the geographic variation of these bonus payments as a percentage of the PFS rate.
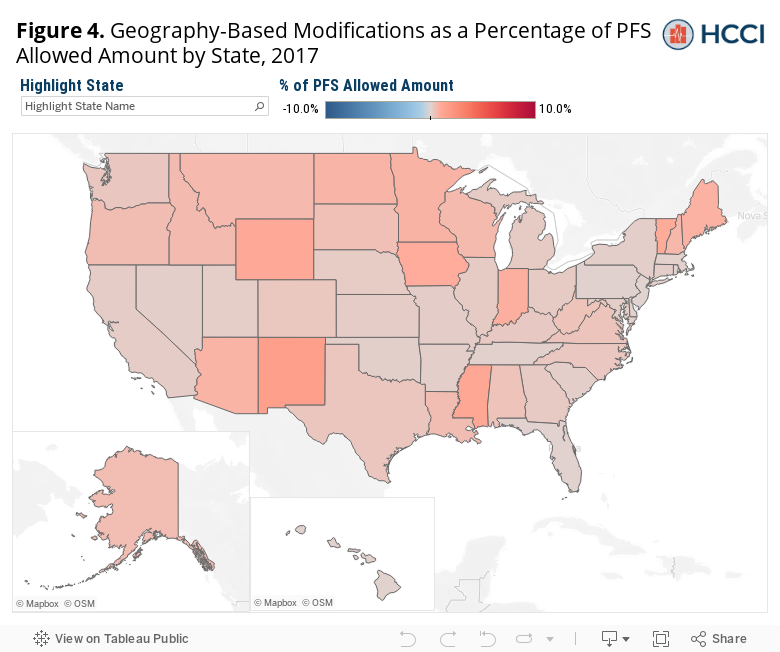
Adjustments to FFS payments targeted to rural and underserved areas ranged from 0% of the PFS rate in New Jersey to 1.6% of the PFS rate in New Mexico. As expected, these bonus payments had a more substantial effect in rural areas. Bonuses in rural areas totaled 1.2% of the PFS rate, as opposed to 0.1% in non-rural areas.
3. Modifications to payments made based on provider-specific characteristics
Three classes of provider-dependent payment reductions and bonuses affect the difference between published PFS rates and actual FFS reimbursement: a) payment modifications based on the credentials of the provider, b) the electronic health record (EHR) incentive program, and c) value-based purchasing and quality-based incentive bonuses.
3a. Provider Credentials.
Medicare PFS rates for physician assistants, nurse midwives, nurse practitioners, and licensed clinical social workers are lower than for physicians (either 65%, 75%, or 85% of the PFS rate depending on factors such as the care delivery setting and the type of provider). CMS also reimburses physicians assisting in surgeries 62.5% of the PFS rate. Our 2017 analytic dataset suggests that, taken together, these lower payments were responsible for approximately $2.2 billion of the difference between FFS payments and the published PFS rate.7 Figure 5 shows the geographic variation of these lower payments as a percentage of the total PFS allowed amount.
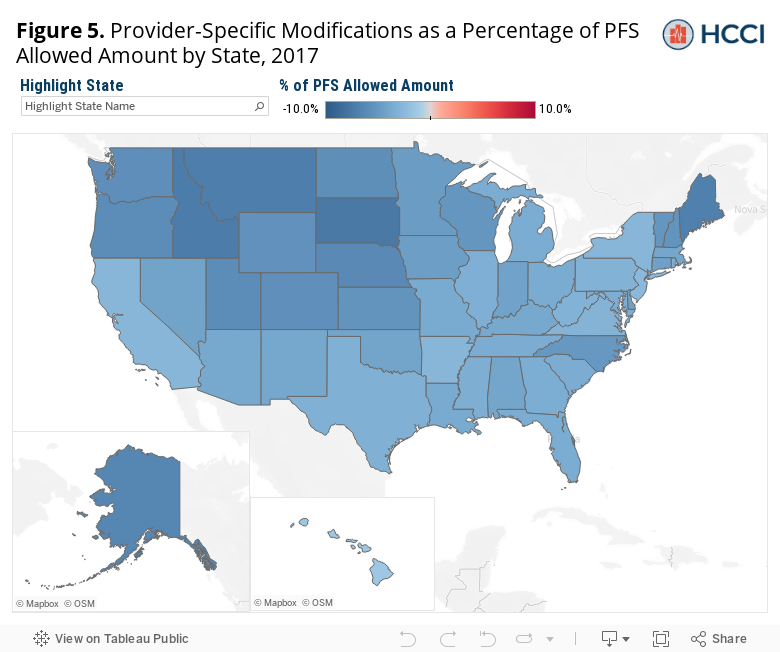
Provider-specific adjustments to FFS payments ranged from -7.5% of the PFS rate in South Dakota to -1.3% of the PFS rate in Washington, DC. The average reduction as a percentage of PFS across the country is relatively large, at -4.4%. These provider-specific adjustments are the most variable among all factors and classes of payment modifications, likely because states regulate practice licensure of professionals, some states may restrict practice activities of differently credentialed providers, and variation in these providers’ availability may affect the volume of services they deliver.
3b. Electronic Health Record Incentive Programs.
The EHR incentive program was established by CMS in 2011 to encourage eligible professionals, hospitals, and CAHs to adopt, implement, upgrade, and demonstrate meaningful use of certified EHR technology. Bonus payments made to providers demonstrating meaningful use under the program, estimated to be about $433 million in the first three quarters of 2017, are not included in our analytic dataset. Payment reductions for providers not demonstrating meaningful use of EHRs, however, are included. Those reductions to FFS payments amounted to approximately $232 million, or about 3.1% of the PFS rate.
3c. Value-based purchasing and quality-based incentive bonuses.
Value-based purchasing or alternative payment models, generally, are voluntary care delivery approaches that aim to promote quality care instead of incentivizing high volume of care.8 Medicare FFS claims data primarily captures reductions in payments while up-front payments or end-of-year bonus payments to providers are not captured in FFS claims data. In our 2017 claims data set, we observe a $487 million reduction in payments from the Next Generation ACO, Comprehensive Primary Care Plus (CPC+), and the Value-Based Modifier Program as well as the Physician Quality Reporting System and the Ambulatory Surgical Center Quality Reporting Program, which encourage providers to report health care quality data to CMS. Payment reductions in the claims by these programs generally reflect regulatory accounting of services, and not the true cost of participation in the program. For example, the Comprehensive Primary Care Plus (CPC+) program awarded nearly $123 million in prospective and bonus payments to providers in 2017. The payment reductions at the claim level for CPC+ (approximately $27 million) merely reflect a change in the structure of payments.
4. Procedure-specific modifications on the care delivered for certain procedures or during global periods
We identified two classes of payment modifications that depend on the kind of care being delivered: a) payment modifications based on additional or reduced effort made by the provider, and b) payment reductions for certain services delivered during a global period or reductions to component payments for certain multiples of procedures delivered on the same day.
4a. Payment modifications based on additional or reduced effort.
CMS pays 150% of the PFS rate for bilateral procedures – procedures performed on both the right and left side of the patient’s body during the same session (e.g., knee replacement). From our 2017 analytic dataset, these additional payments amounted to $236 million above the PFS rate. In addition, CMS may increase or reduce payments based on additional or reduced provider effort. As this modification is determined on a case-by-case basis, we did not quantify the spending amounts for these categories. In 2017, however, there were approximately 590,000 services with a modifier indicating it had been flagged for review to qualify for additional or reduced effort payments.
4b. Global Periods and Multiple Procedures.
Our procedure-specific adjustments also include reduced payments associated with a global period, such as unplanned returns to the operating room or certain post-operative management care, amounting to approximately $329 million in 2017. CMS has established global payments for certain surgical procedures where payment for the procedure covers both the procedure and post-operative visits within a period (either 0, 10 or 90 days depending on the procedure). Our analysis did not account for the non-payment of services delivered in the post-operative period covered under global period rules.
We also include the effect of the Multiple Procedure Payment Reduction (MPPR) rules and other reductions for certain providers when multiple services are delivered. Generally, CMS will not reimburse a provider for delivering the same or similar service to the same patient on the same encounter. However, under MPPR, Medicare will pay 50% of the PFS rate for the second and subsequent procedures performed during the same patient encounter in certain circumstances. These types of payments are most prevalent for endoscopy, ophthalmology, diagnostic imaging, cardiovascular imaging, and therapy. While we were unable to quantify the overall reduction amounts from MPPR, given that these rules impact procedures common among certain specialty providers, we would hypothesize that these reimbursement rates rules would disproportionally impact the aforementioned specialties.
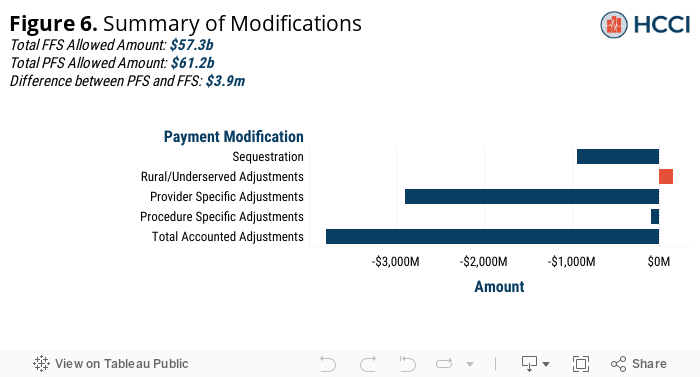
Modifications Summary
Our analysis accounts for a majority of the difference between FFS payments and PFS rates in 2017, or an estimated $3.8 billion out of $3.9 billion. Figure 6 below shows a summary of the previously discussed payment modifications to the PFS, including the total adjusted amount in dollars and whether, on net, the factor would cause FFS payments to be higher or lower than PFS rates.
Policy impact depends on whether payment is tied to the Physician Fee Schedule or actual Fee-for-Service claims
A consequence of the difference between Medicare reimbursements and Medicare prices as listed in the fee schedule is that policies designed to peg commercial reimbursements to Medicare rates would have different effects depending on which Medicare rate is utilized. In the first portion of this analysis, to show this, we analogously computed and subsequently compared the average commercial professional service price to our average FFS and PFS prices for the same basket of services using a sample of commercial claims in the same metro areas. As seen in Figure 7, across metro areas, commercial prices for professional services averaged a slightly higher percentage of Medicare reimbursements (FFS) than a percentage of the prices paid on the Medicare fee schedule (PFS). In other words, commercial prices were relatively more expensive compared to Medicare FFS prices than they were to Medicare PFS prices.
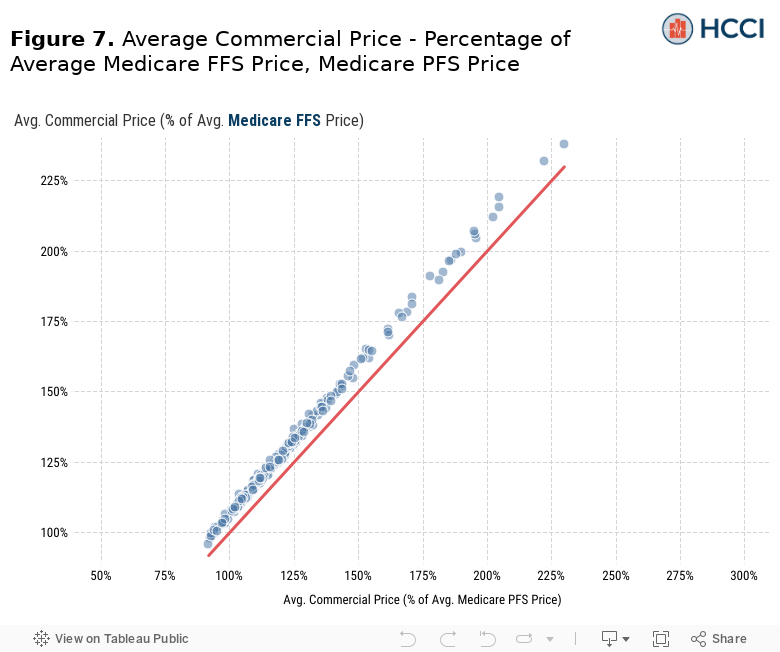
Consider a hypothetical policy designed to cap commercial insurance prices at 120% of Medicare rates applied uniformly to all of our sample metro areas. Commercial professional service prices average more than 120% of Medicare rates in 118 metro areas in our sample (out of 271). A hypothetical policy based on Medicare prices as designated by the PFS would likely affect commercial prices in all 118 of these metro areas appreciably. However, there are an additional 49 metro areas where average commercial prices are higher than 120% of average Medicare FFS reimbursements. If this hypothetical policy were based on benchmarking commercial prices to 120% of average Medicare reimbursements for each service, it would potentially have a broader impact.
Conclusion
Policymakers have attempted to rein in US health care spending for many years. These efforts have mostly been unsuccessful, particularly in addressing widespread variation among the prices paid by commercial insurers. Newer efforts have focused on policies benchmarking private health insurance payments in some way to Medicare rates. These proposals seek to leverage the Medicare programs position as a “price setter,” to rein in some of the distortions we see in private sector pricing. However, like most health policy proposals, the devil is in the details.
We have shown in this paper that depending on the data source – PFS rate or FFS payment – there is a difference of about $4 per service (5.6%) when weighted for a common mix of commercial services. While this difference may seem small on a per service basis, we show that, in the aggregate, the amount ultimately paid by Medicare to providers for professional services (i.e., total FFS payments) was nearly $4 billion less than in the would-be total for Medicare payments based off the published PFS rates in 20179. Moreover, we showed the difference in total payments was due to factors that varied by geography as well. Some of those factors, such as adoption of electronic health records, have largely been successful in achieving health policy goals outside of reduced spending.
Endnotes
1 Our analytic dataset of the 29 million beneficiaries utilizing PFS services in 2017 reflects the subset of the 38 million beneficiaries enrolled in original Medicare who utilized at least one PFS service paid for by Medicare Part B (e.g. excluding those where Medicare was the secondary payer).
2 In our sample, 29 million Medicare Beneficiaries used 543 million distinct professional services in 2017.
3 In our sample, total allowed spending on professional service claims in 2017 totaled $56.3 billion.
4 Note, we only had reliable claims data from the CMS Research Identifiable Files (RIFs), consequently we were unable to completely reconcile the two measurement methodologies. In addition, we did not have detailed data on most bonus payments that CMS makes.
5 Rural/non-rural designation was assigned using 2010 Rural-Urban Commuting Area (RUCA) Codes from the USDA, based on zip code. Zip codes with a primary RUCA code of 1, 2, or 3 was considered “non-rural,” and those with code 4 or higher was considered “rural.”
6 Note, the $935 million in sequestration cuts amounts to approximately 1.6% of PFS allowed amounts; sequestration is applied to government spending, and not to the beneficiary out-of-pocket amounts.
7 Note, this amount was derived directly from the claim for some categories and indirectly estimated from the modifier on the claim for other categories.
8 These models constitute a relatively small share of Medicare lives; according to one study of ACOs, in 2017, there were approximately 35 million beneficiaries assigned to nearly 1,000 provider groups, of which about 60 percent were commercial, 30 percent were Medicare, and 10 percent were Medicaid.
9 Excluding bonus to providers under the EHR incentive program, value-based purchasing models, or other global bonus payments.